vScriptValShapeRenderHistogram
Render a bar chart from an array of scalar values.
Mograph / ScriptValScriptValArrayJSON
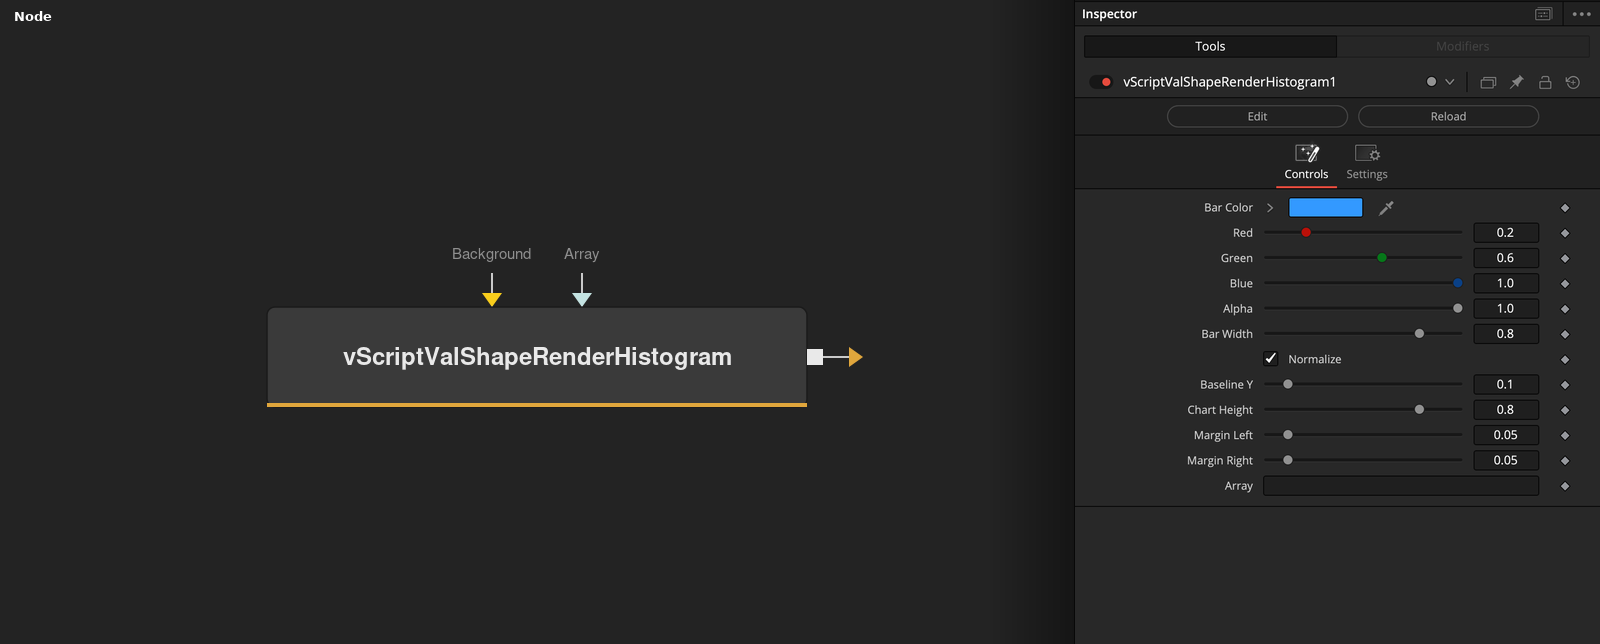
Parameters
| Parameter | Type | Default | Description |
|---|---|---|---|
| Red | Float | 0.2 | — |
| Green | Float | 0.6 | — |
| Blue | Float | 1.0 | — |
| Alpha | Float | 1.0 | — |
| Bar Width | Float | 0.8 | — |
+7 more parameters
| Parameter | Type | Default | Description |
|---|---|---|---|
| Normalize | Integer | 1 | — |
| Baseline Y | Float | 0.1 | — |
| Chart Height | Float | 0.8 | — |
| Margin Left | Float | 0.05 | — |
| Margin Right | Float | 0.05 | — |
| Input | Image | — | — |
| Array | ScriptVal | — | — |