Lightfielder Operators | Nodes View
Ops has a node graph that allows arbitary data processing to occur. This is handy for building automation workflows in a low-code fasion. The tooling is based upon the Lightfielder "Vonk Ultra" data node toolset.
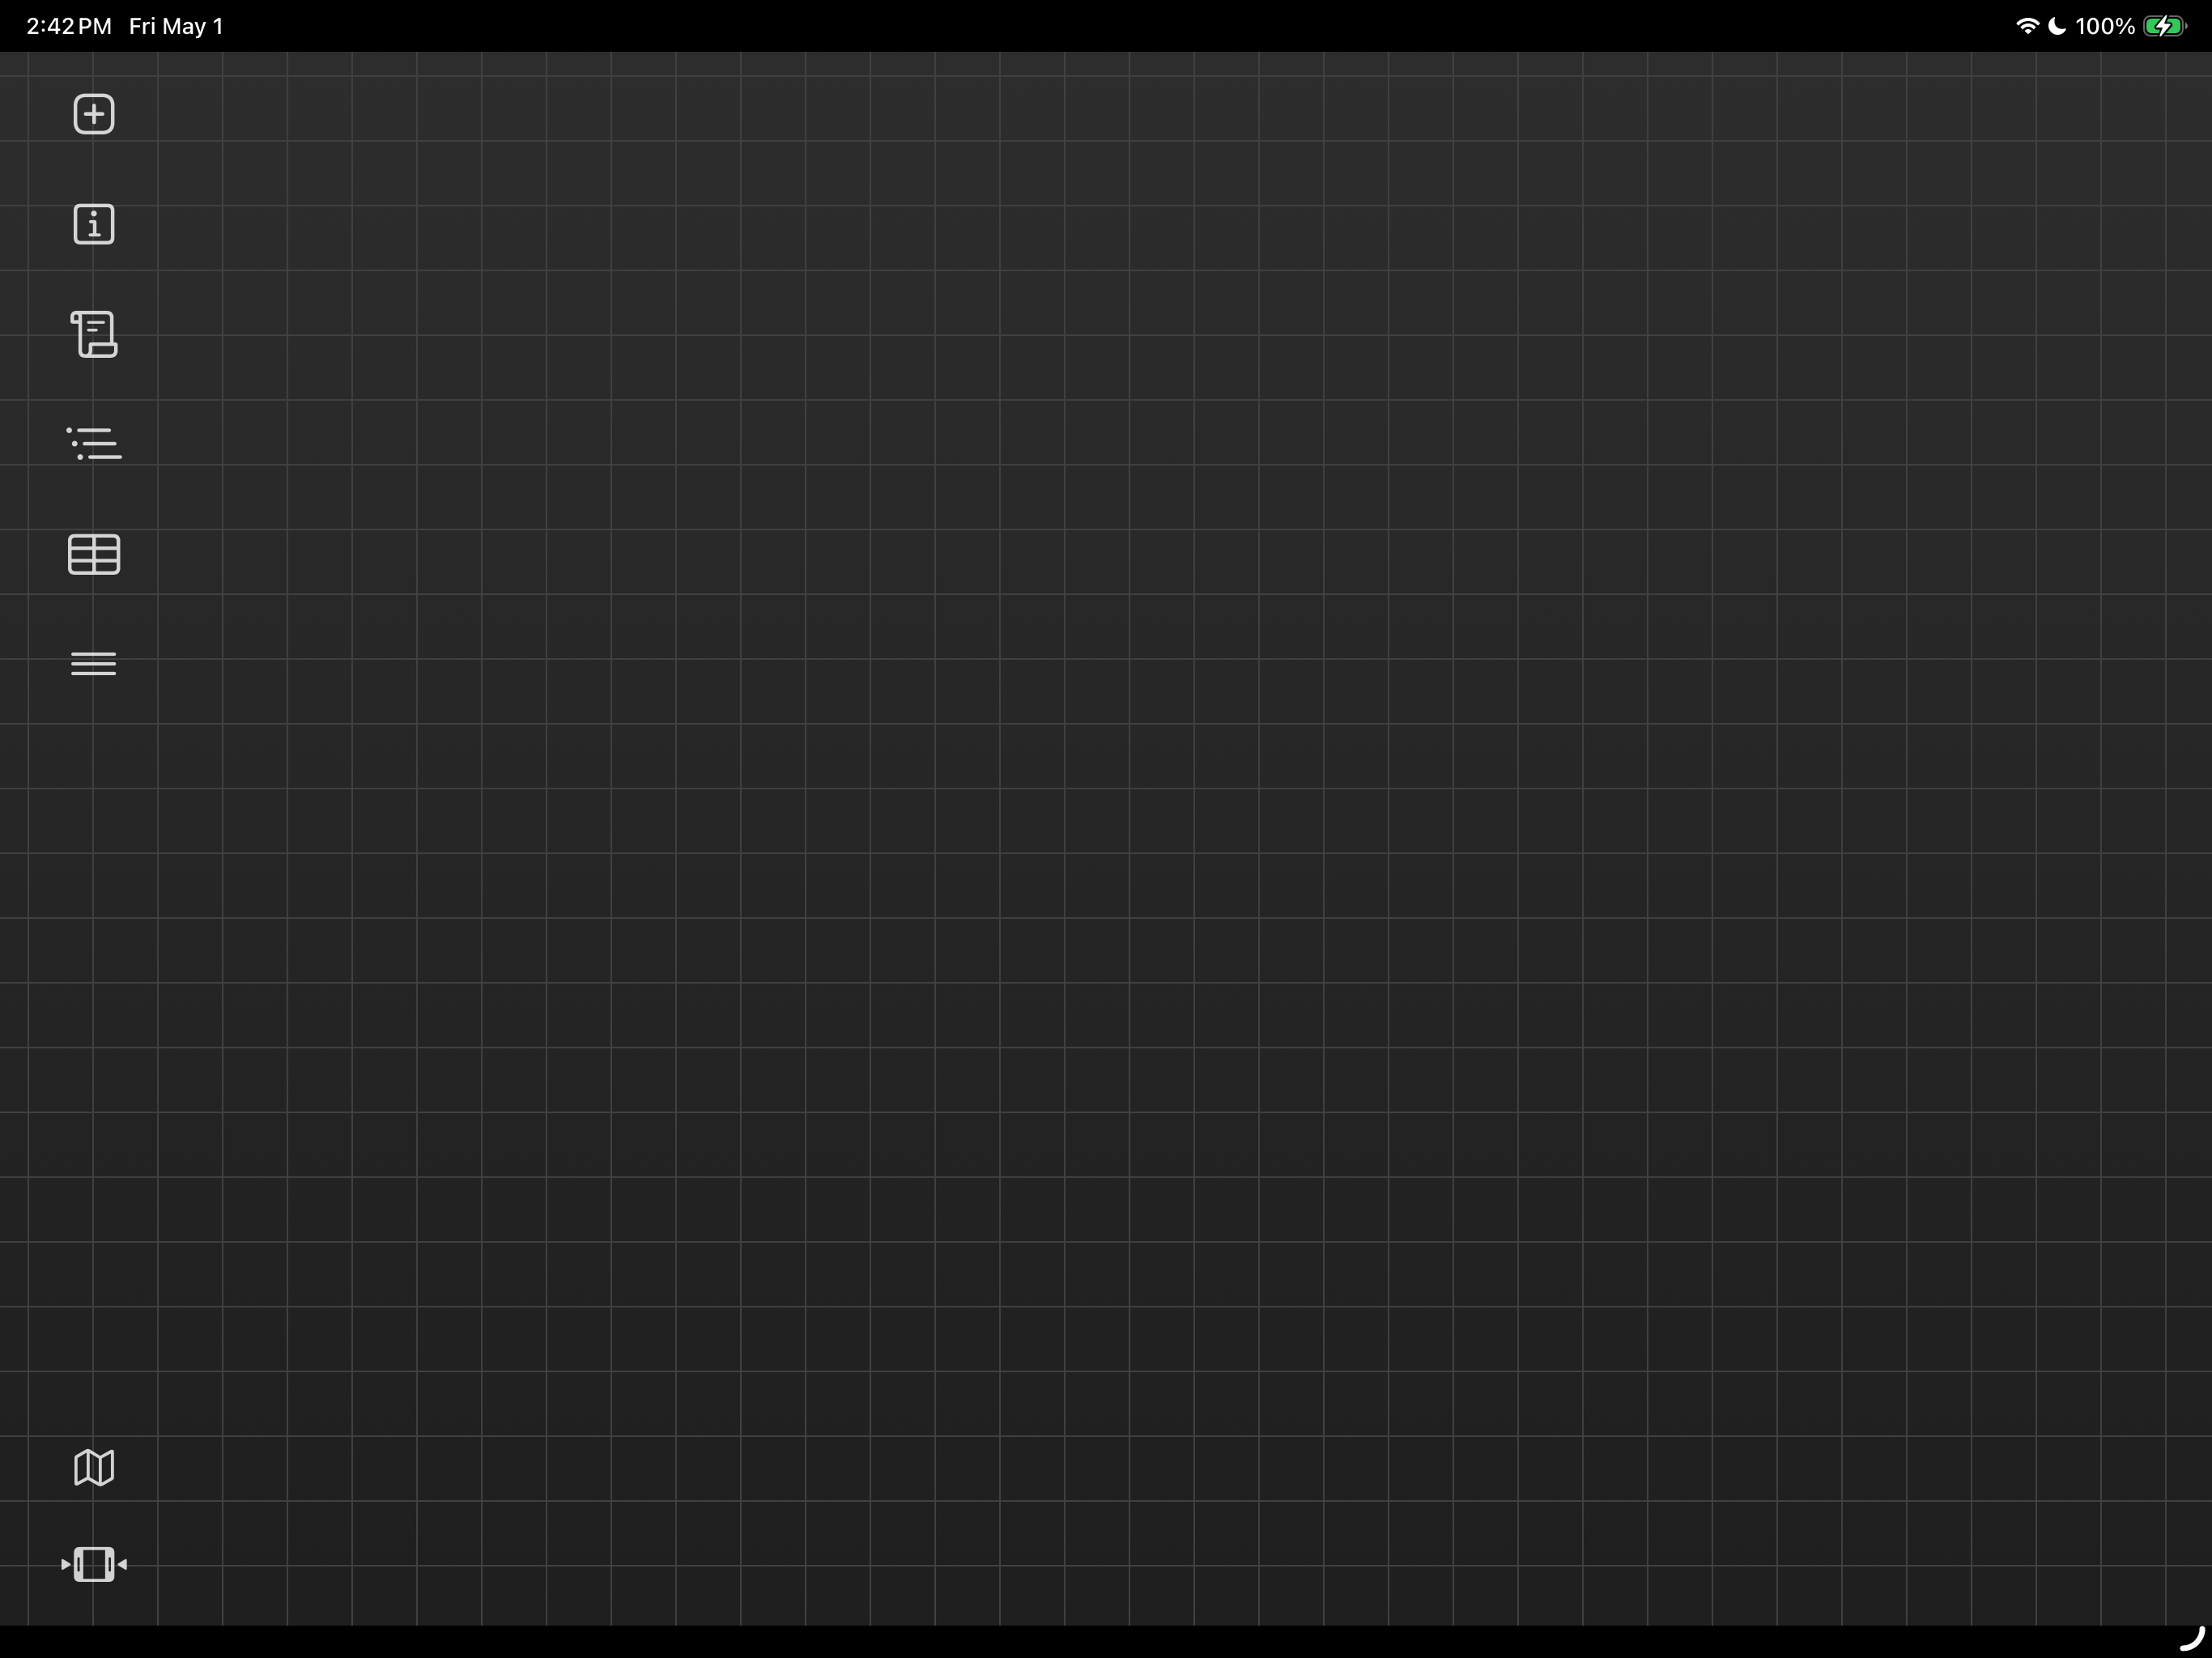
When the node graph is first loaded on the iOS, VisionOS, or macOS Catalyst based thin-client app it shows an empty flow. There is a light grey grid pattern that shows the alignment when nodes are snapped to the grid.
Gestures
Pressing in the blank area of the flow allows you to then drag the entire view to scroll the grid up/down.
Placing two fingers on the grid, and pinching them closer or further apart is how the node layout in the grid can be zoomed.
Double-tapping on a node's connection line will break it.
Selecting one or more nodes in the flow, then shaking them left to right will cause the "external" node connection lines to be broken for the active selection.
Left Toolbar Icons
On the left side of the window is a series of toolbar buttons.
If you click the toolbar icon on the bottom left a timeline panel is displayed. This is how sequences can be played back. You can adjust the Global and Clip level In and Out ranges. The looped playback mode can be toggled. On the far right of the timeline is the Timecode and Frame counter.
There is a "zoom" slider control in the timeline that has the same result in the flow as "pinch to zoom".

Infobar
There is a thin "infobar" line that exist just above the timeline. This region shows general usage tips and hotkey mappings for features. Clicking on the infobar line several times will cycle through each of the provided tips.



Flow
To add nodes to the, simply comp click the "+" plus sign icon at the top left of the toolbar.
The "Create Node" window appears. The node based content listed in the "Create Node" window is sorted by the primary data type they work with such as "Text", "Numbers", "File", etc. This makes it easir to narrow down exactly what you are looking for, even if you don't exactly know what that is yet.
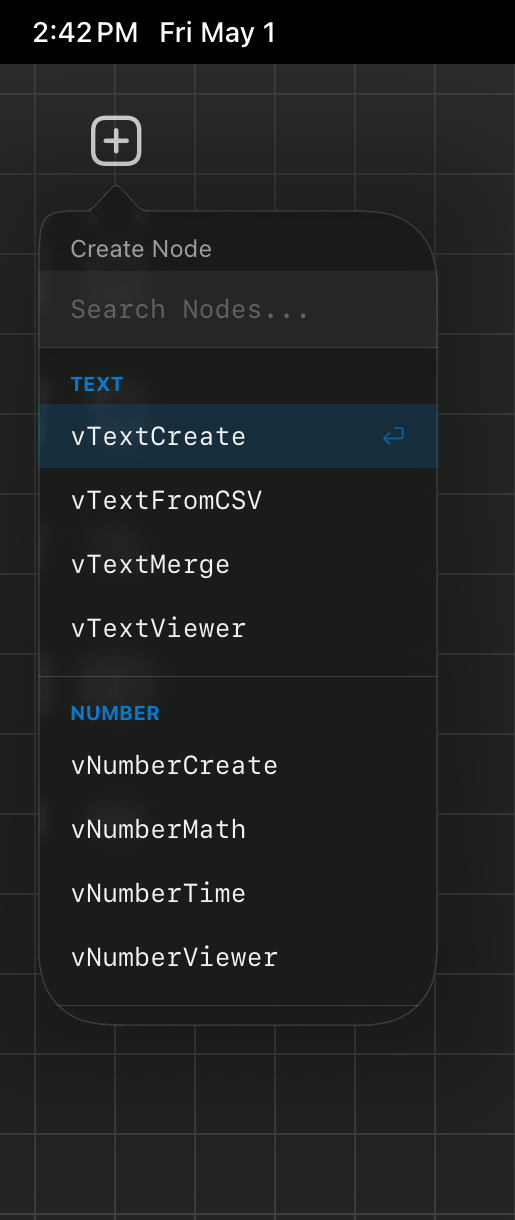
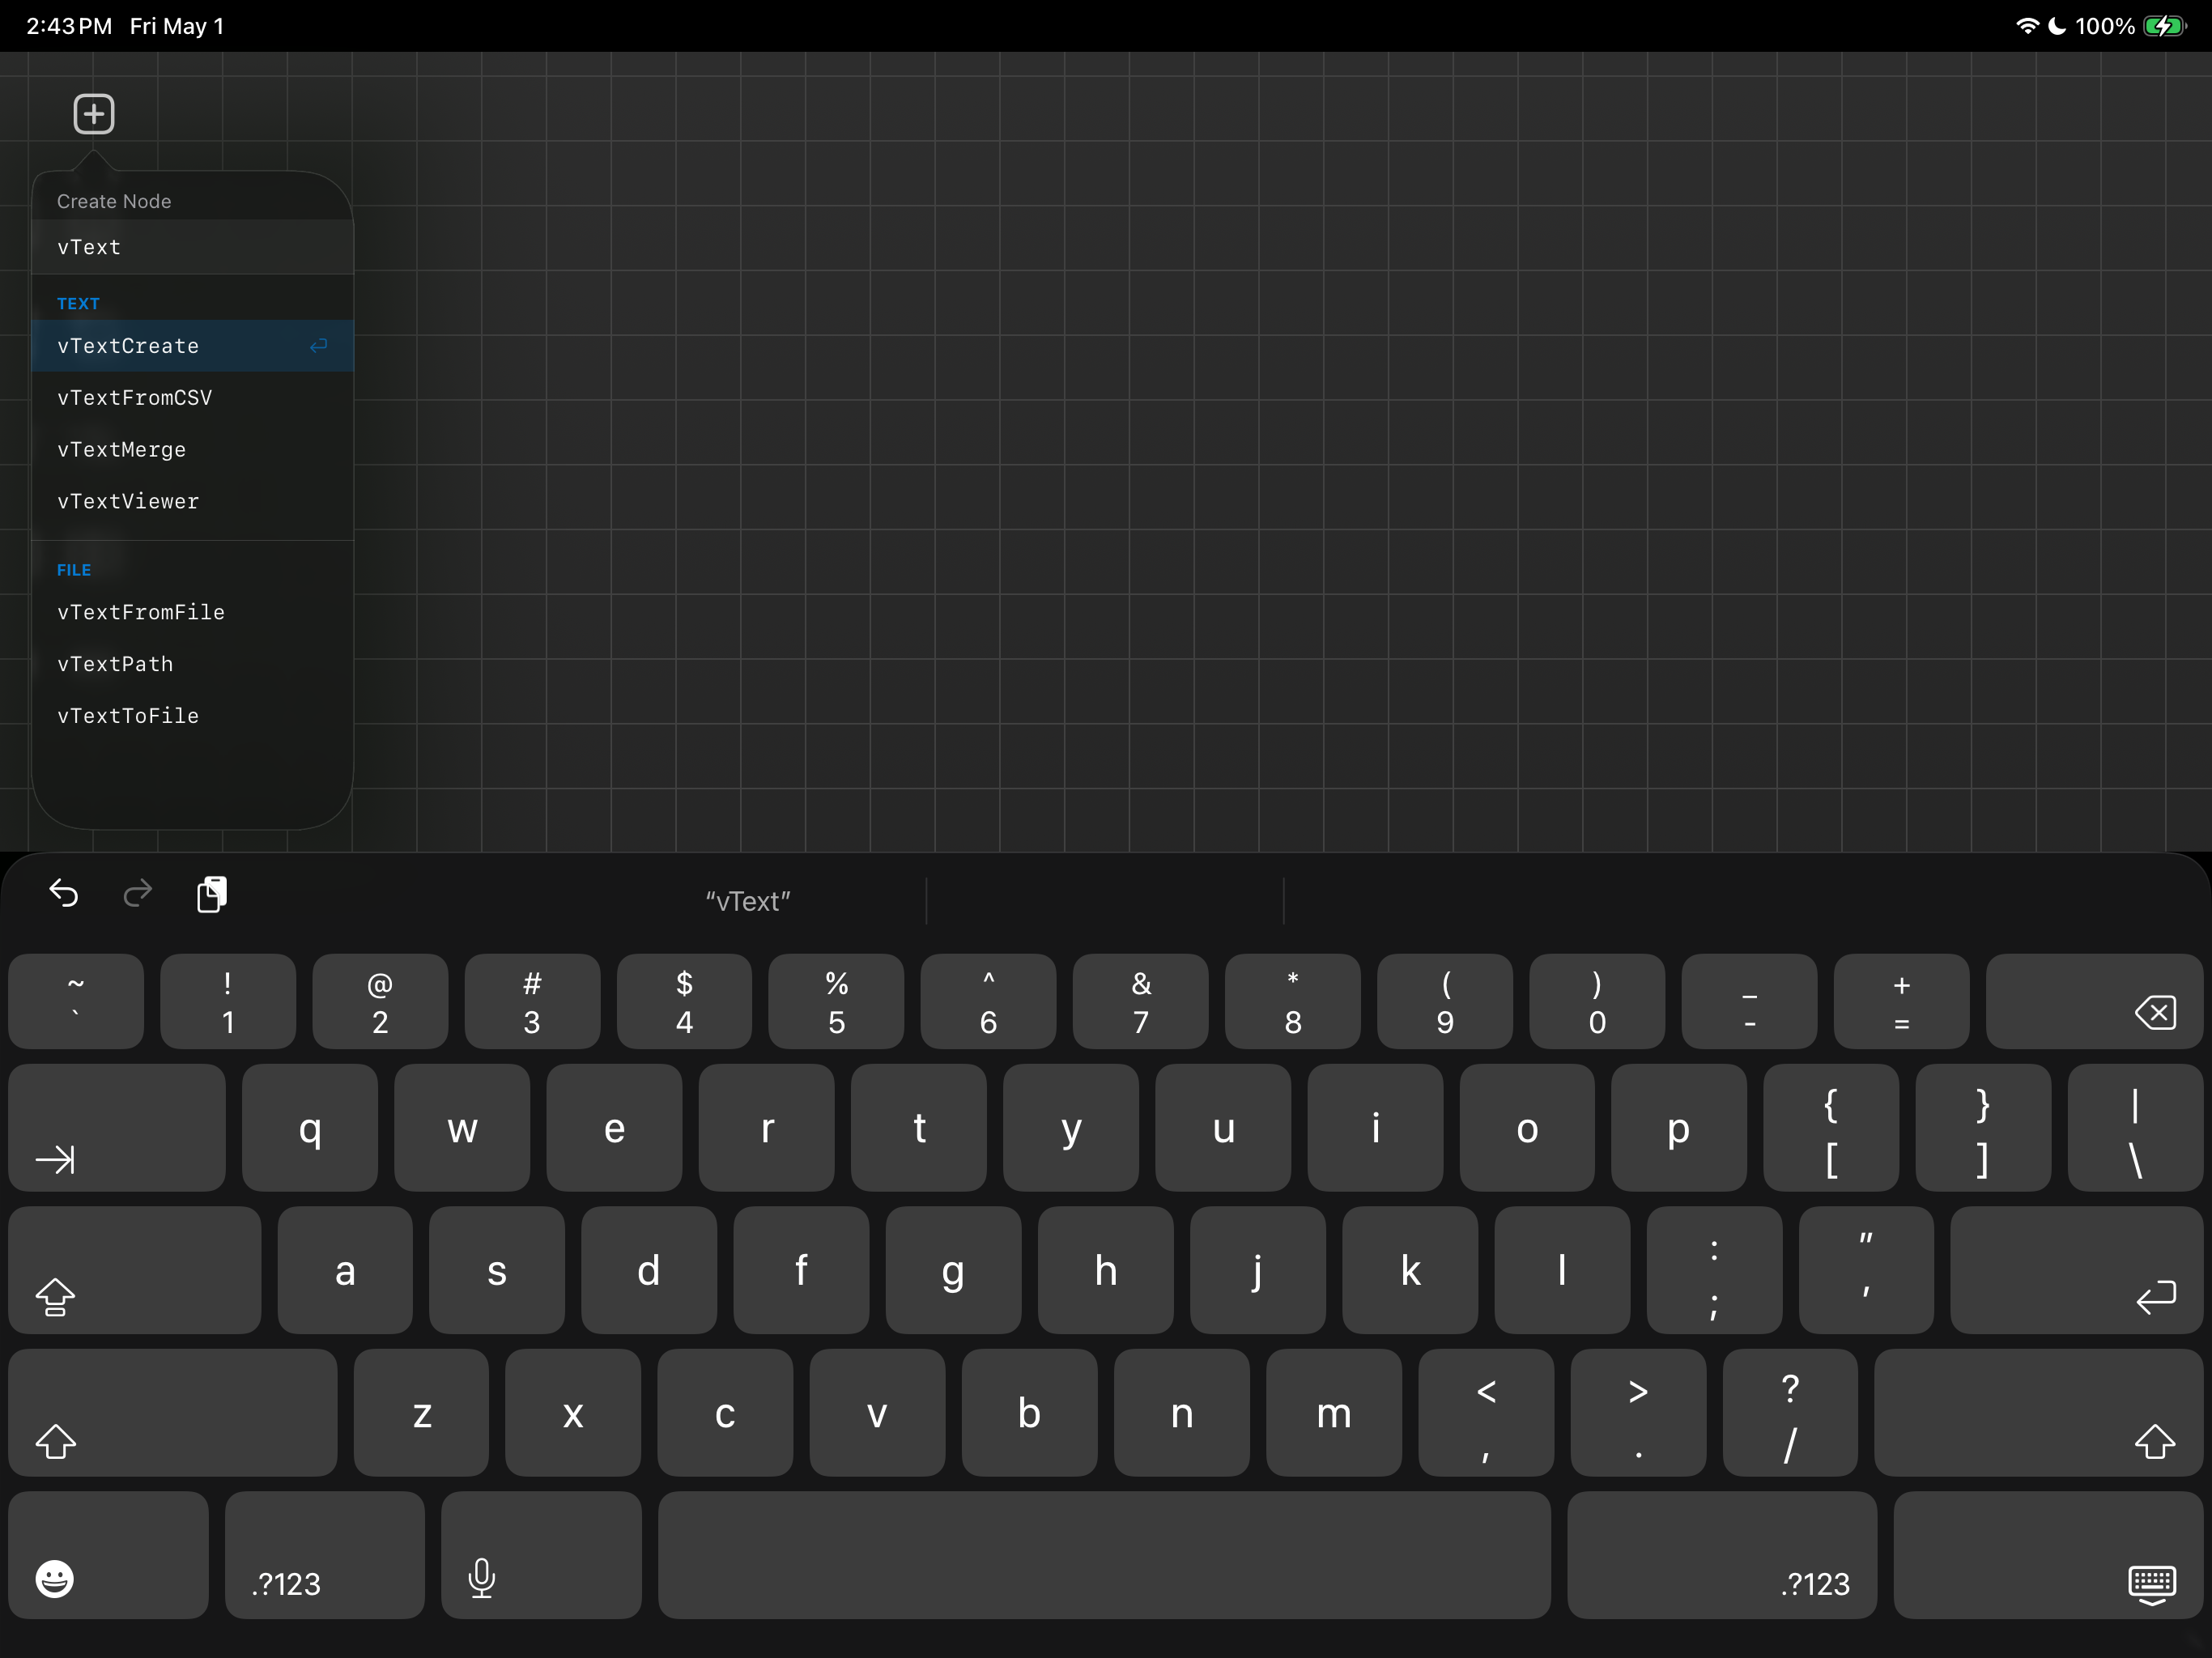
When creating a new node, you can start typing part of the node name into the text field, and the view will automatically filter the list of available nodes that match that search pattern. Or you can scroll down in the "Create Node" window to select the exact node you want to insert into the flow.
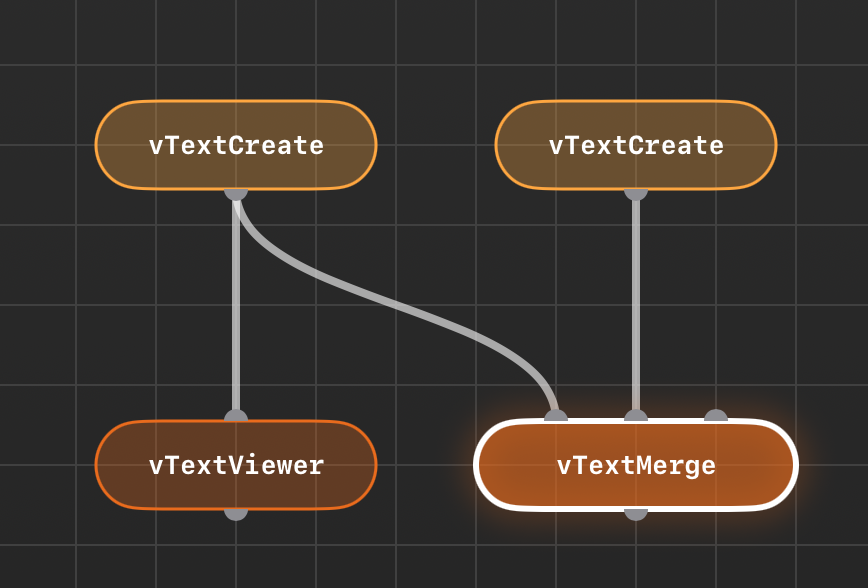
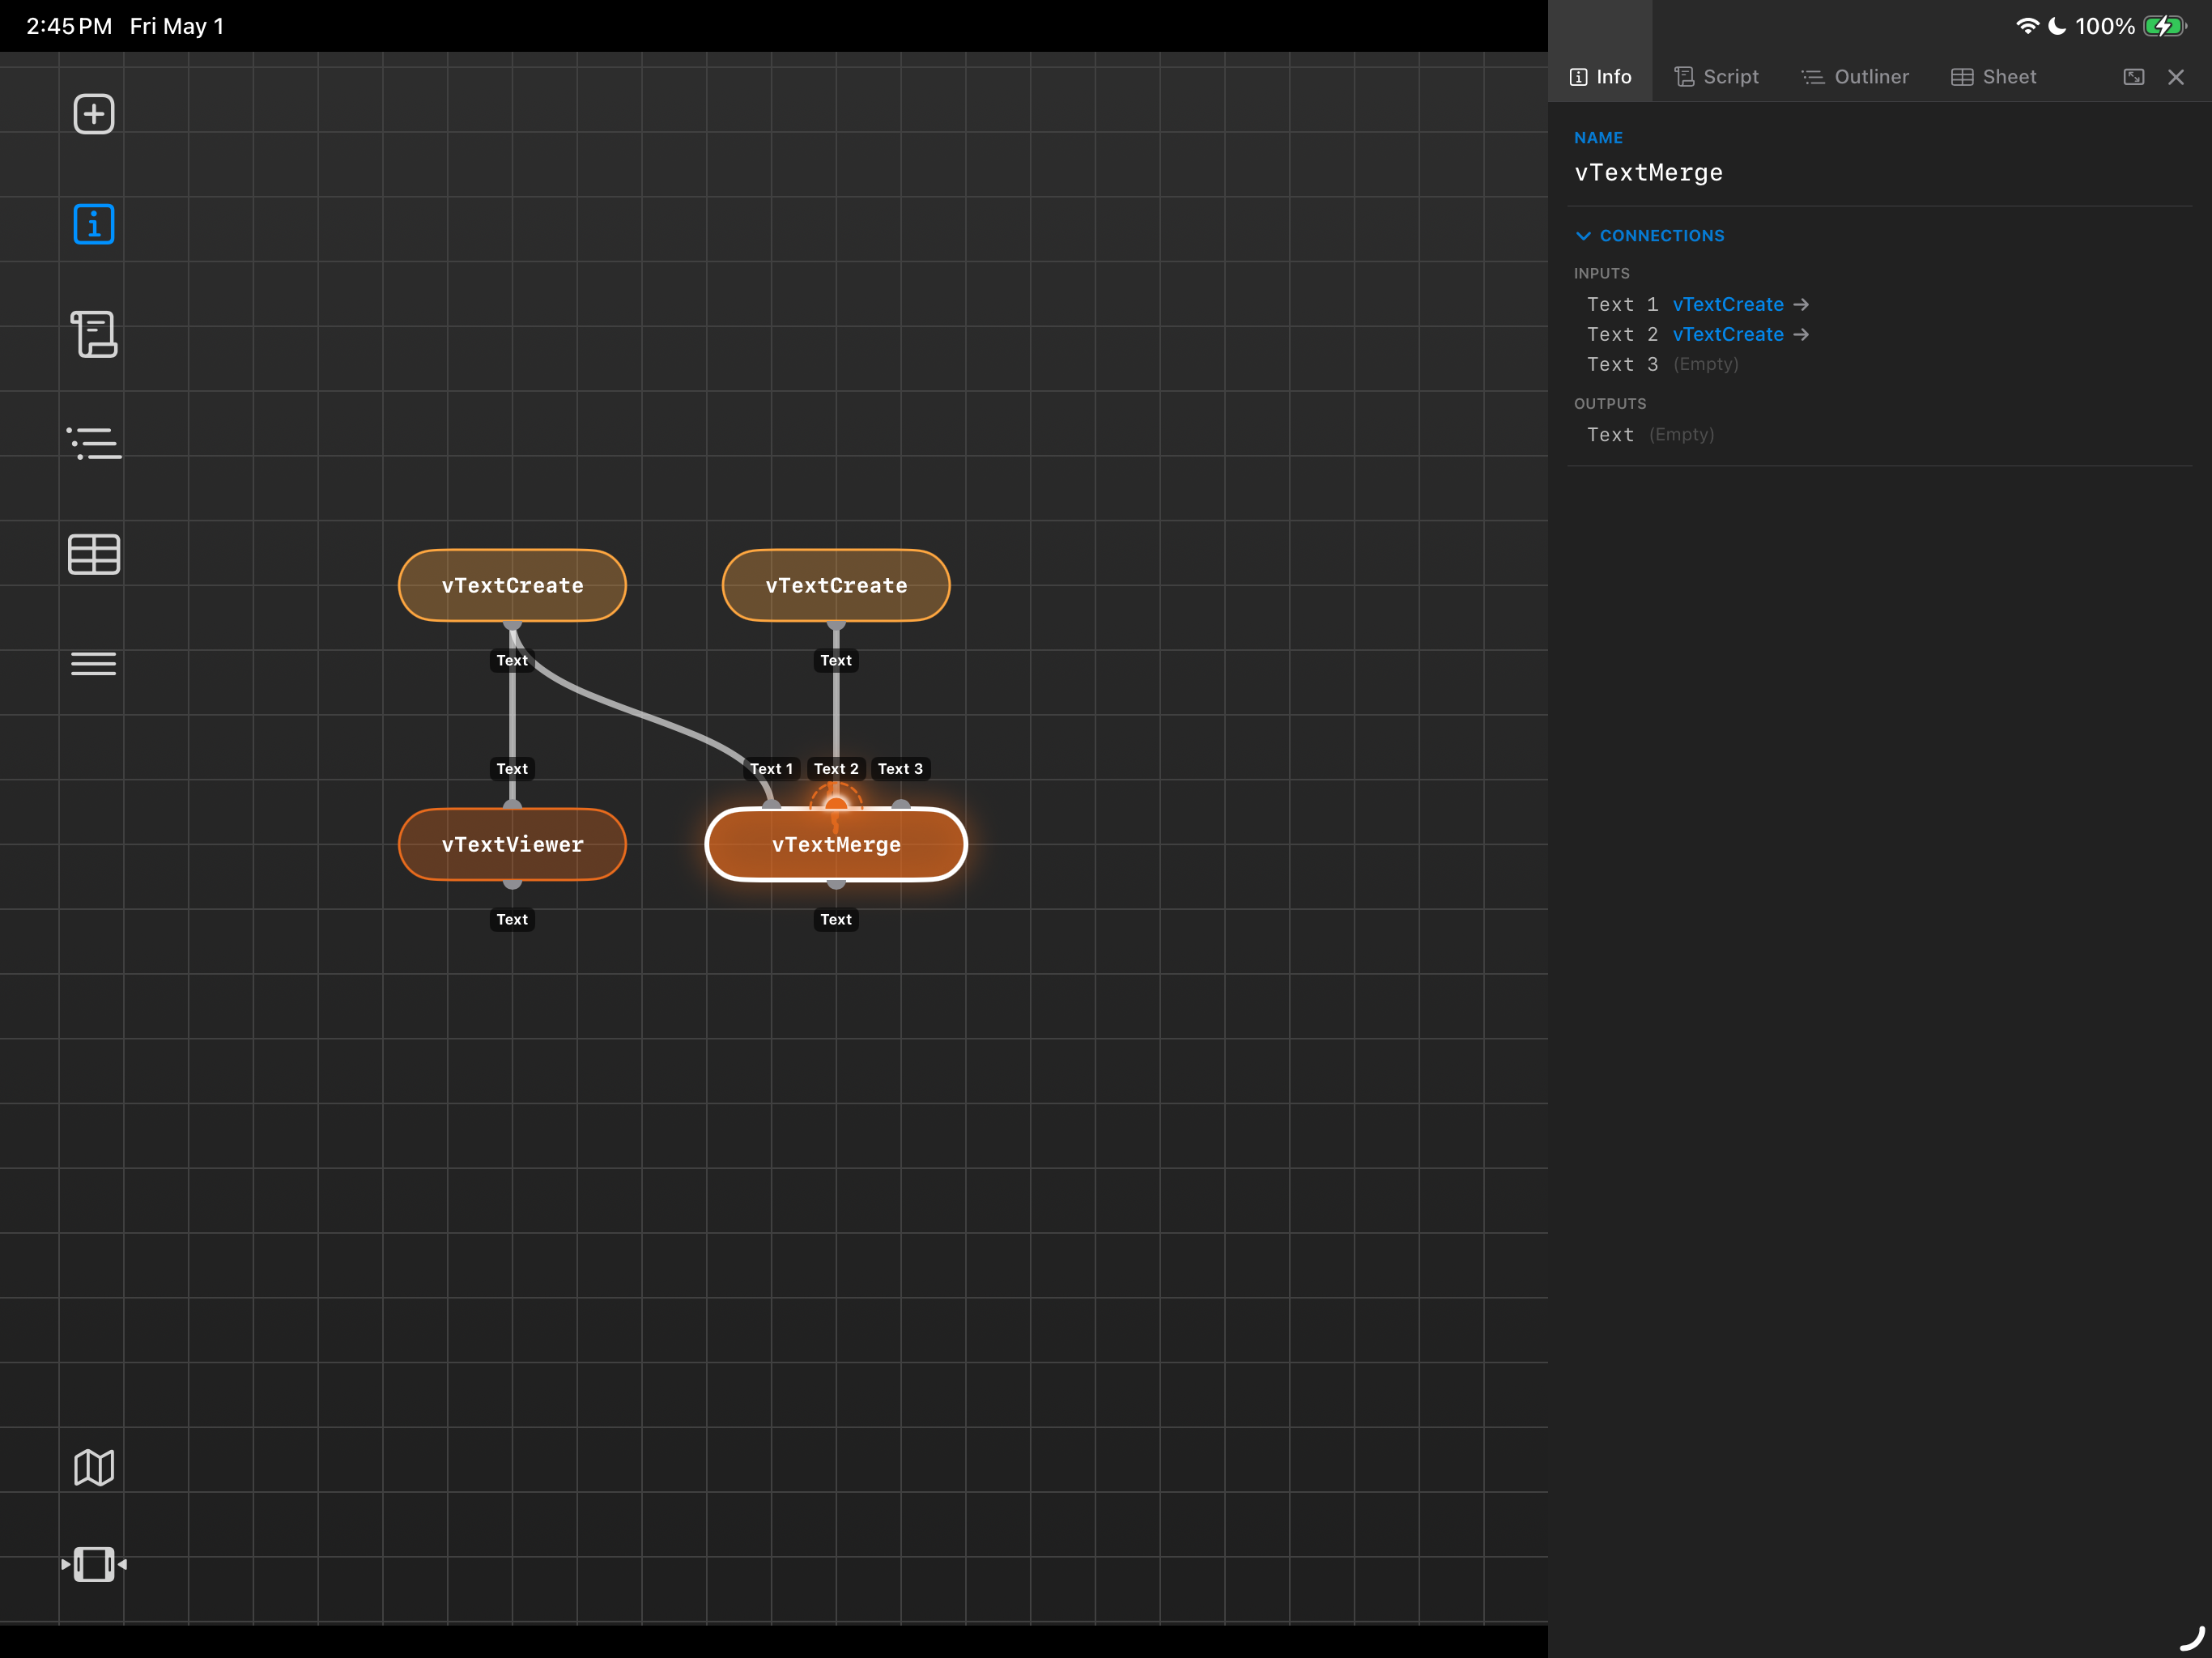
When node connections are being sketched out, the input and output ports have their connection names displayed at each of the "nubs" on the nodes. This tries to balance the needed information being available, while reducing clutter the rest of the time.
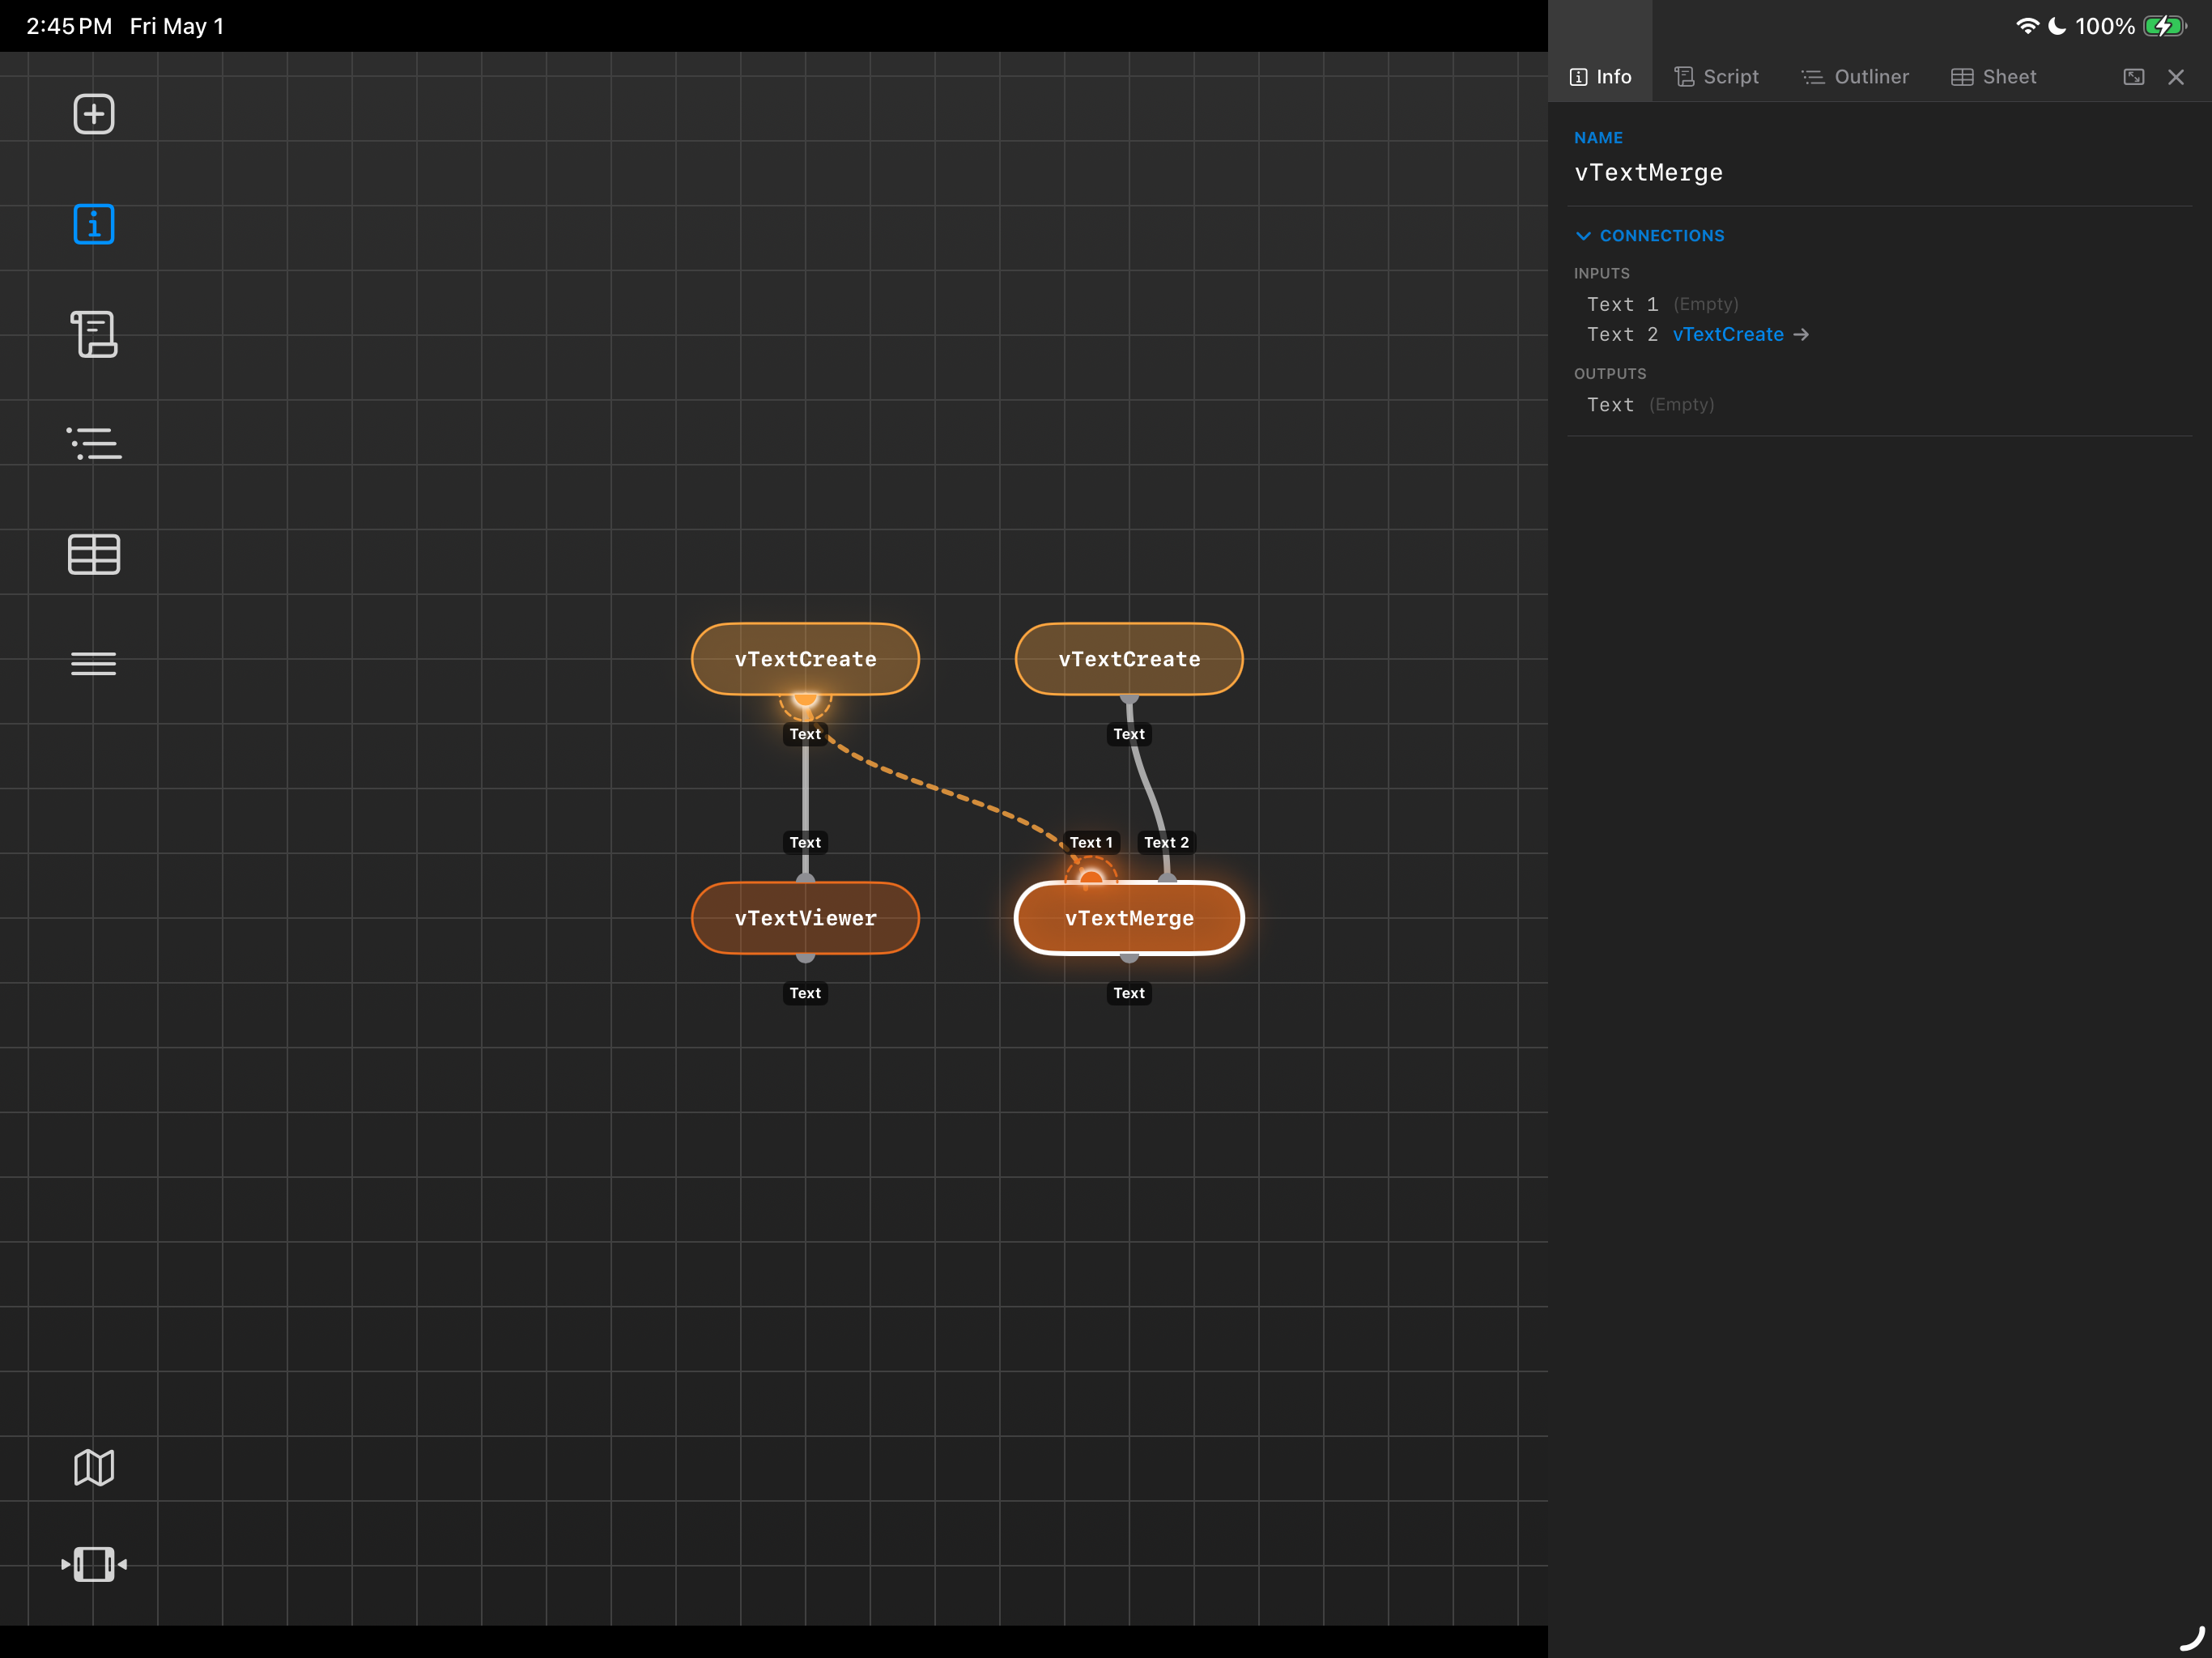
If a new connection line is drawn between nodes, you will see a dashed-line for the noodle path. The two ends of the connection line land on the input/output "nubs" with a large glow radius zone indicated to make it easier to work with a touch based device like a tablet.
The Info panel shows details about the currently selected node in the flow. In the connection section of the Info panel, you can click on the text elements next to one of the node's Inputs or Outputs. This will hop the active selection in the flow to that node, and pan the flow view to recenter it, if required. You will see an "energy" pulse animated down the connection path as the attention changes betwen the selected nodes in the flow.
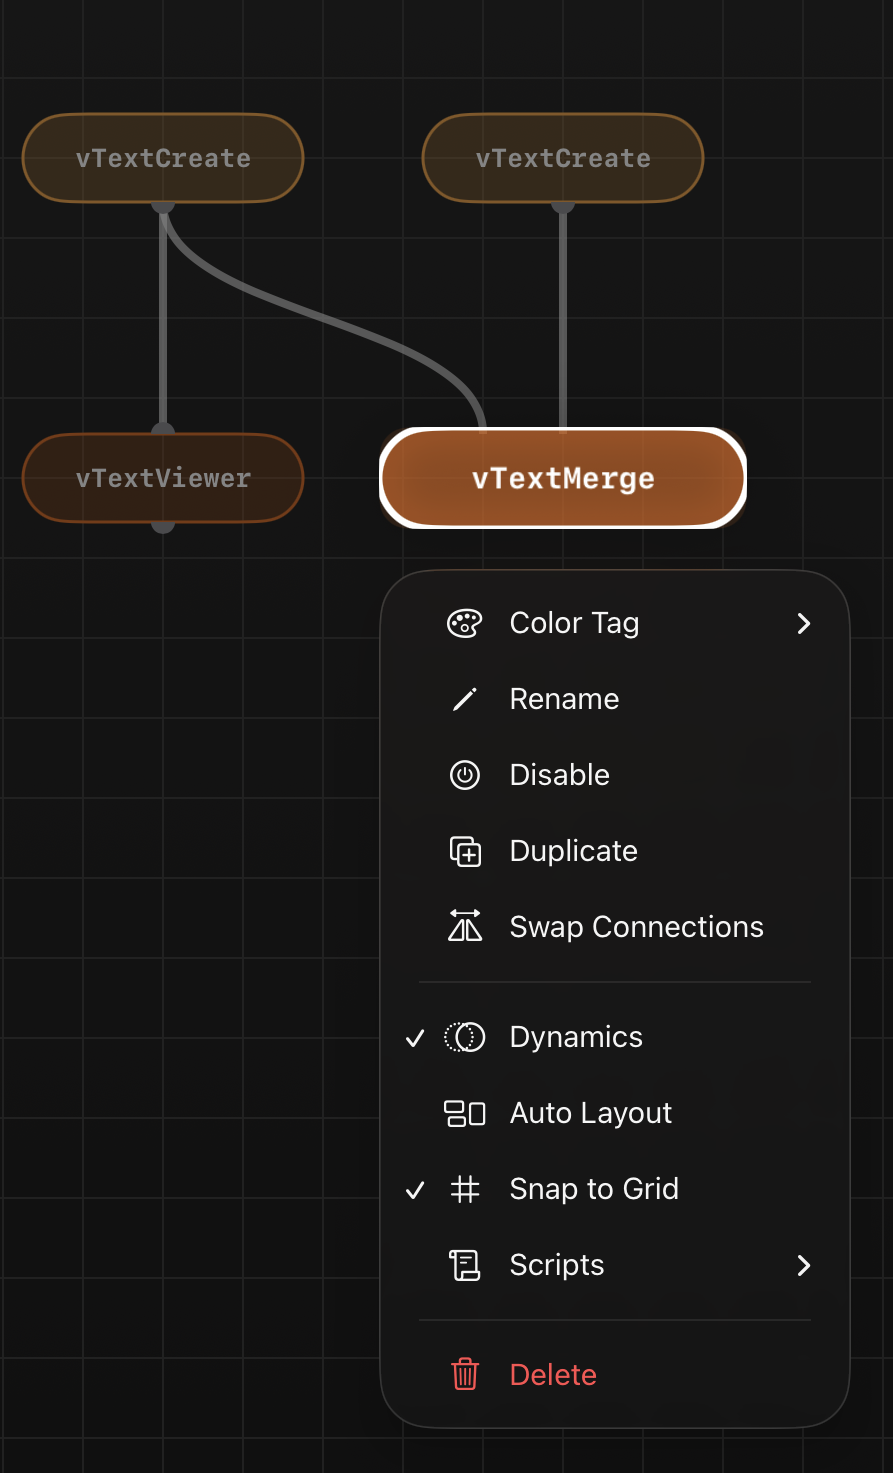
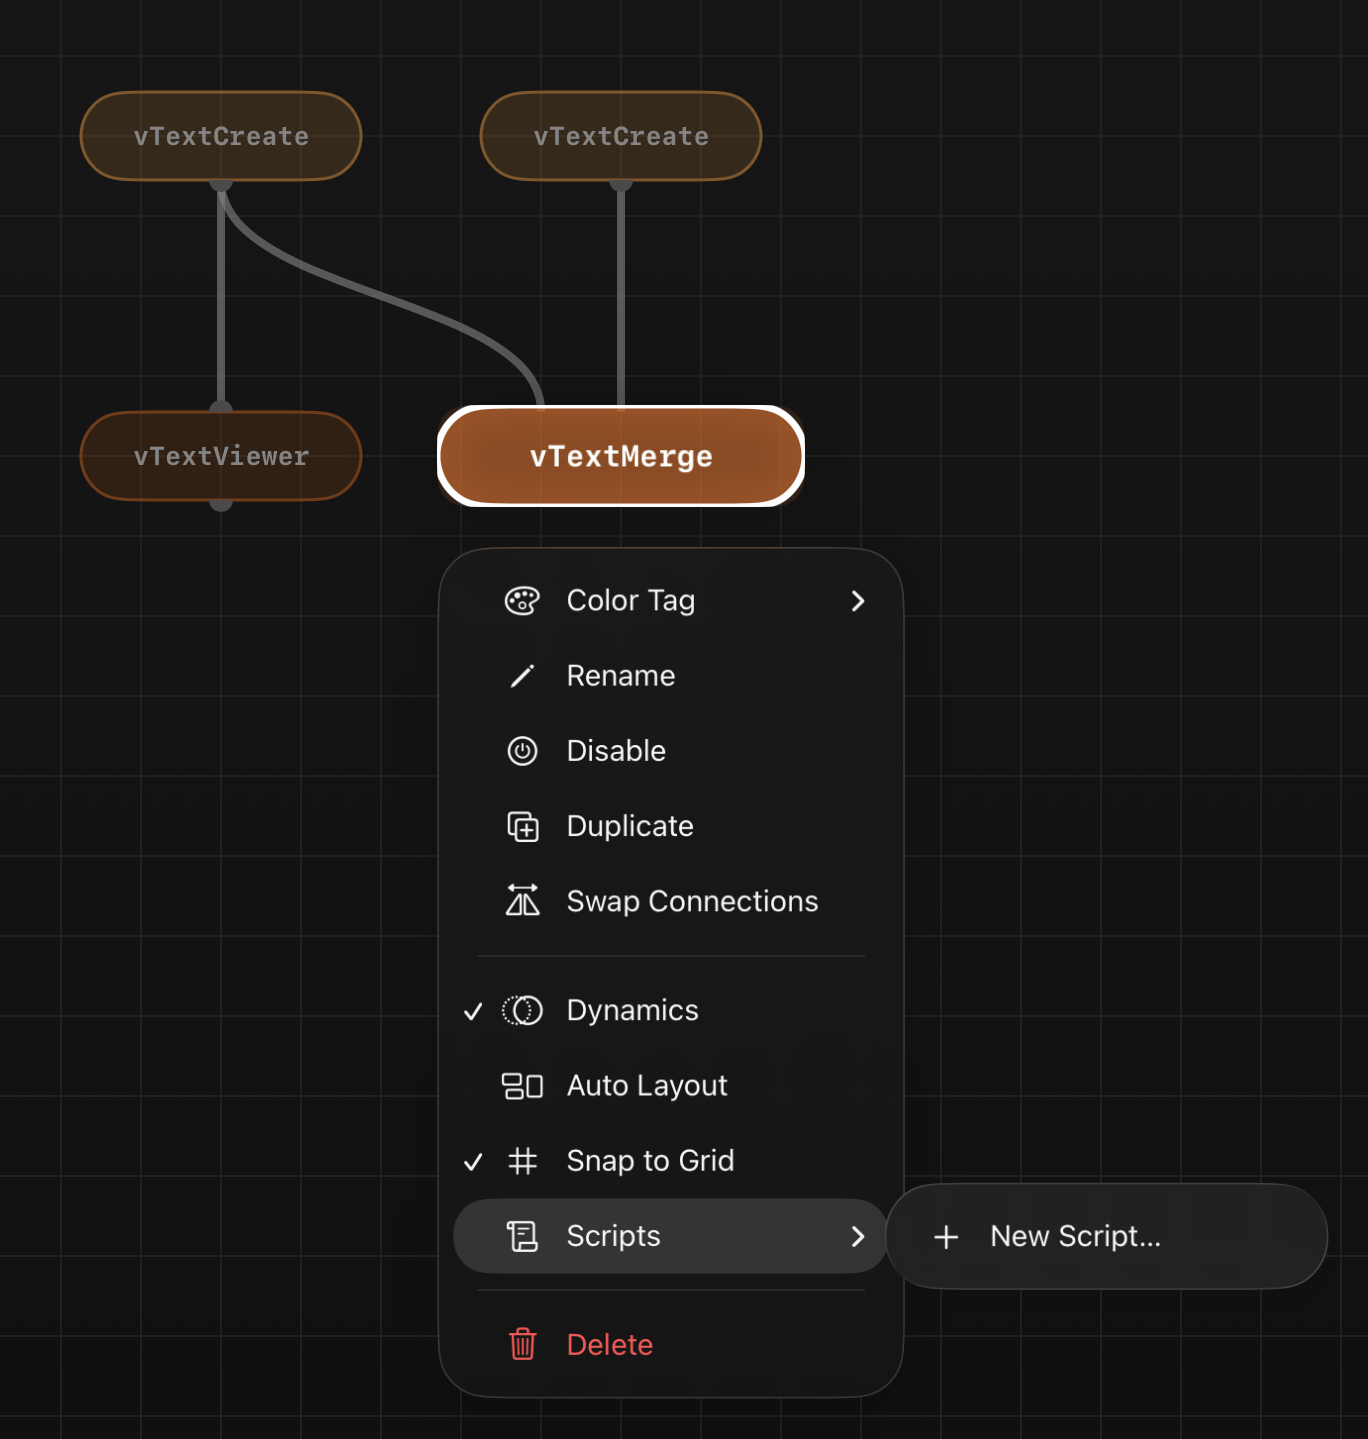
With a node actively selected in the flow, you can long-press on the node to display a context menu.
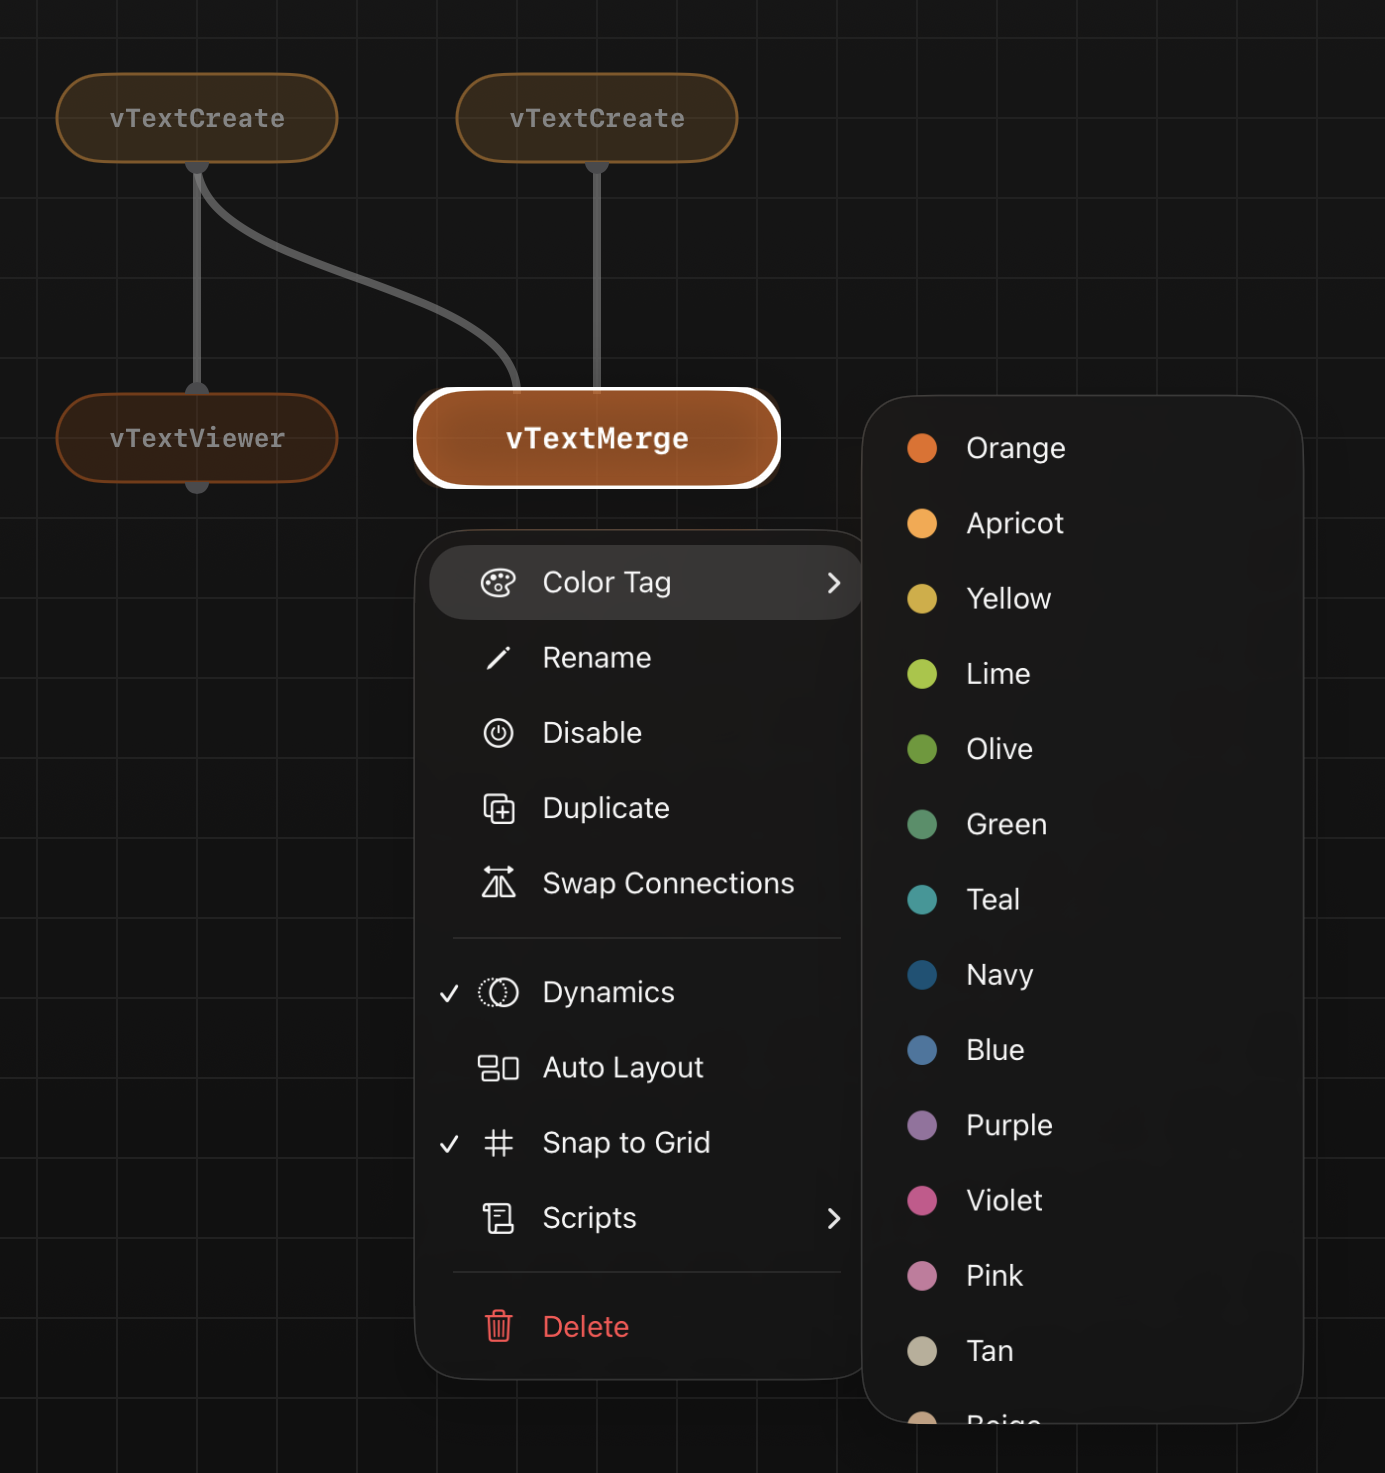
The "Color Tag" section in the context menu is used to change a node's tile color in the flow.
The Scripts section allows you to run a Lua or Python script on the actively selected nodes in the flow.
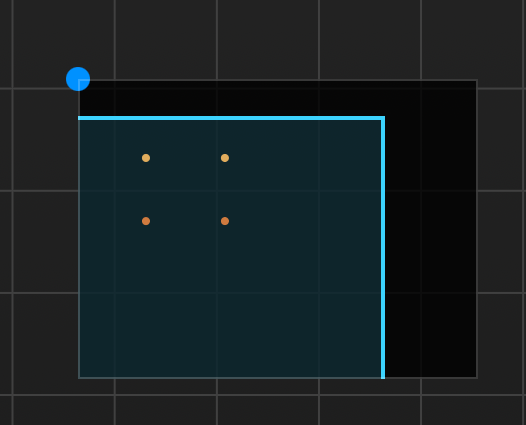
The mini-map view is visible in the bottom right of the flow window. This region gives you an idea of the positioning of nodes that are offscreen beyond the viwable area of th flow. You can pan the view to see the mini-map view also pan as well. The Mini-Map window is hidden or shown by toggling the "map" like button that is 1 icon above the lowest left toolbar item.
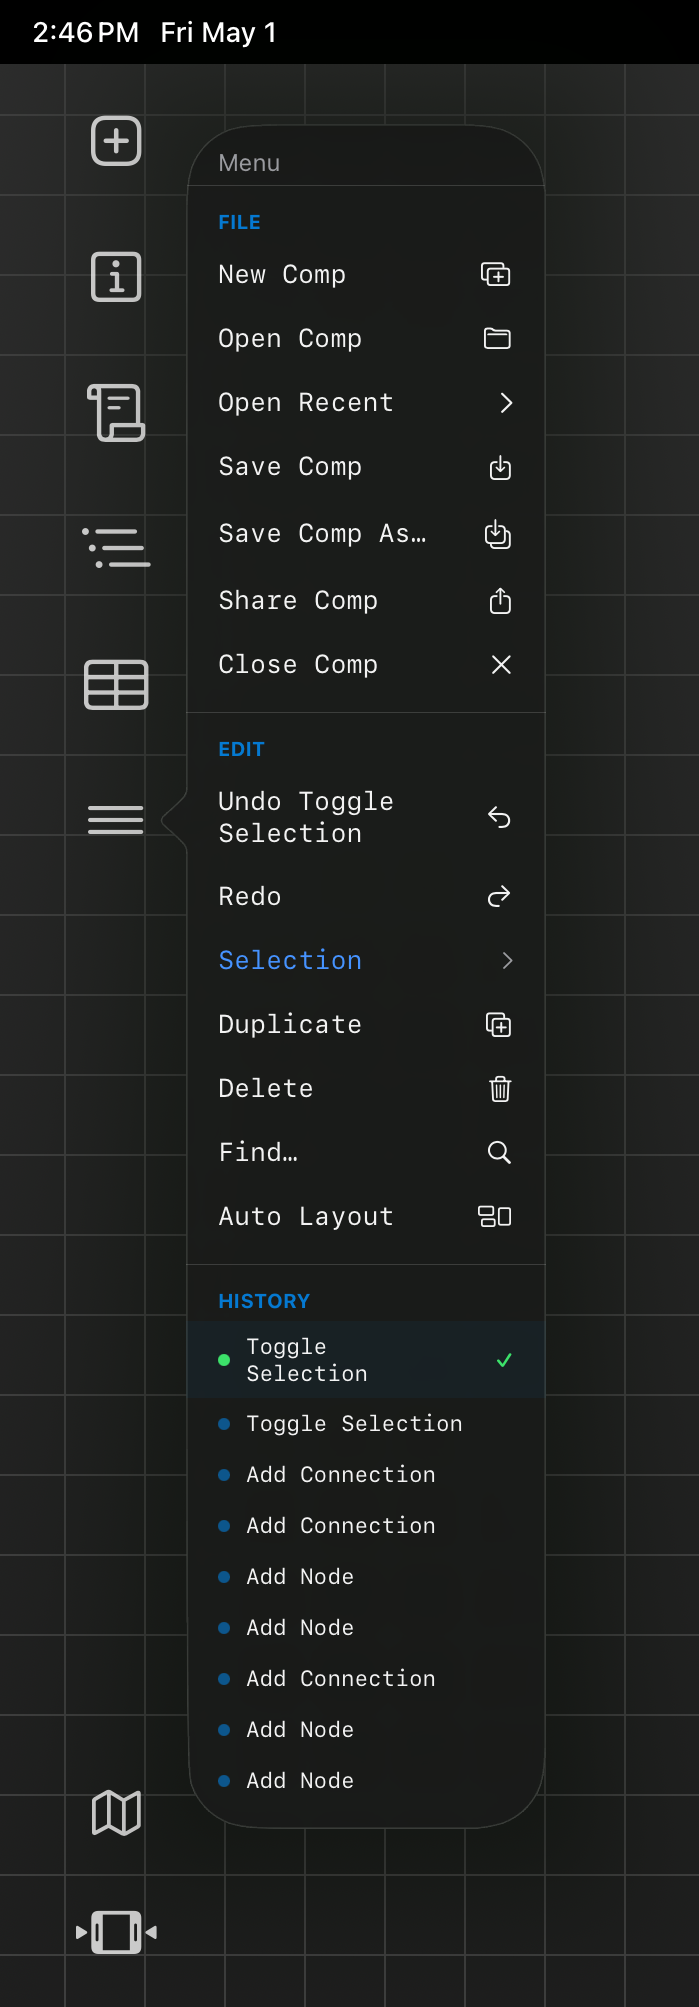
The hamburger toolbar icon displys a menu system. You can access File, Edit, and History items. The AutoLayout command is handy if you want to quickly re-graph the flow and instantly arrange the nodes in an organized fashion.
Info Panel
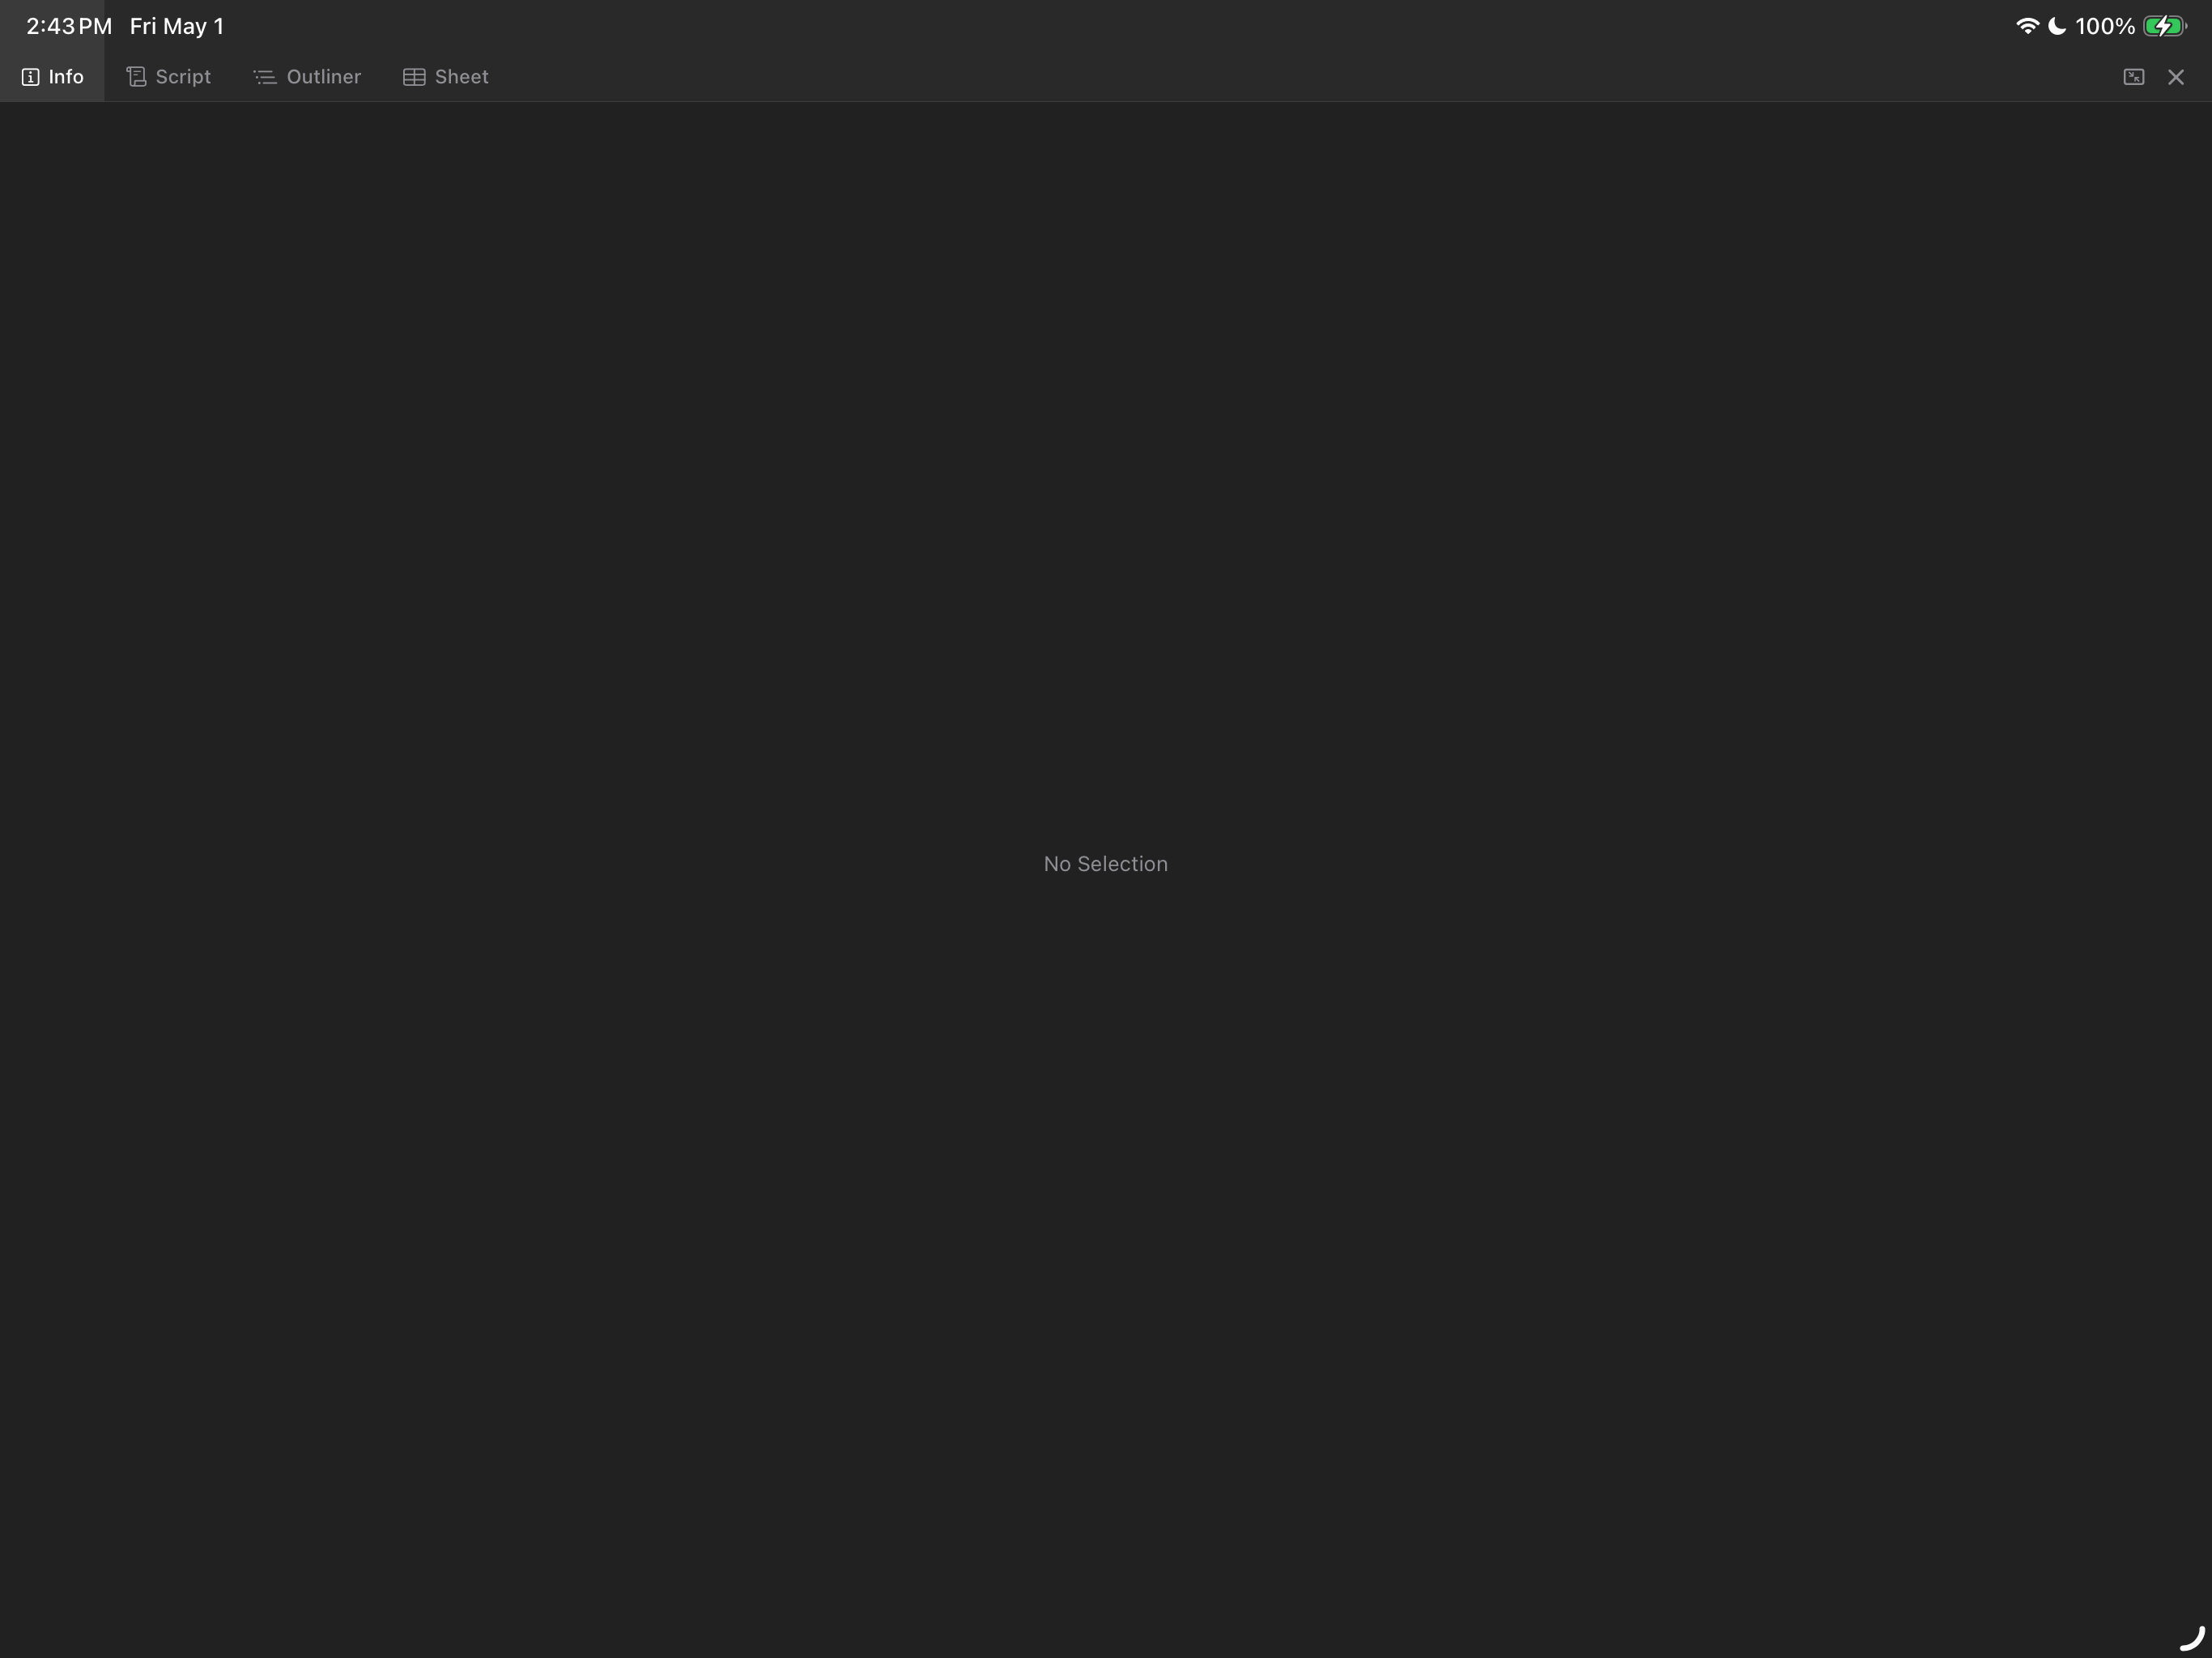
The Info panel, when displayed on the right side of the view can be fully maximized using the tiny "Maximize" icon at the top-right of the window. You need to have a text document open in order to use the Script, Outliner, and Sheet panel tabs.
When a node's "nub" connection ports are highlighted in the flow view you can see the connection port labels.
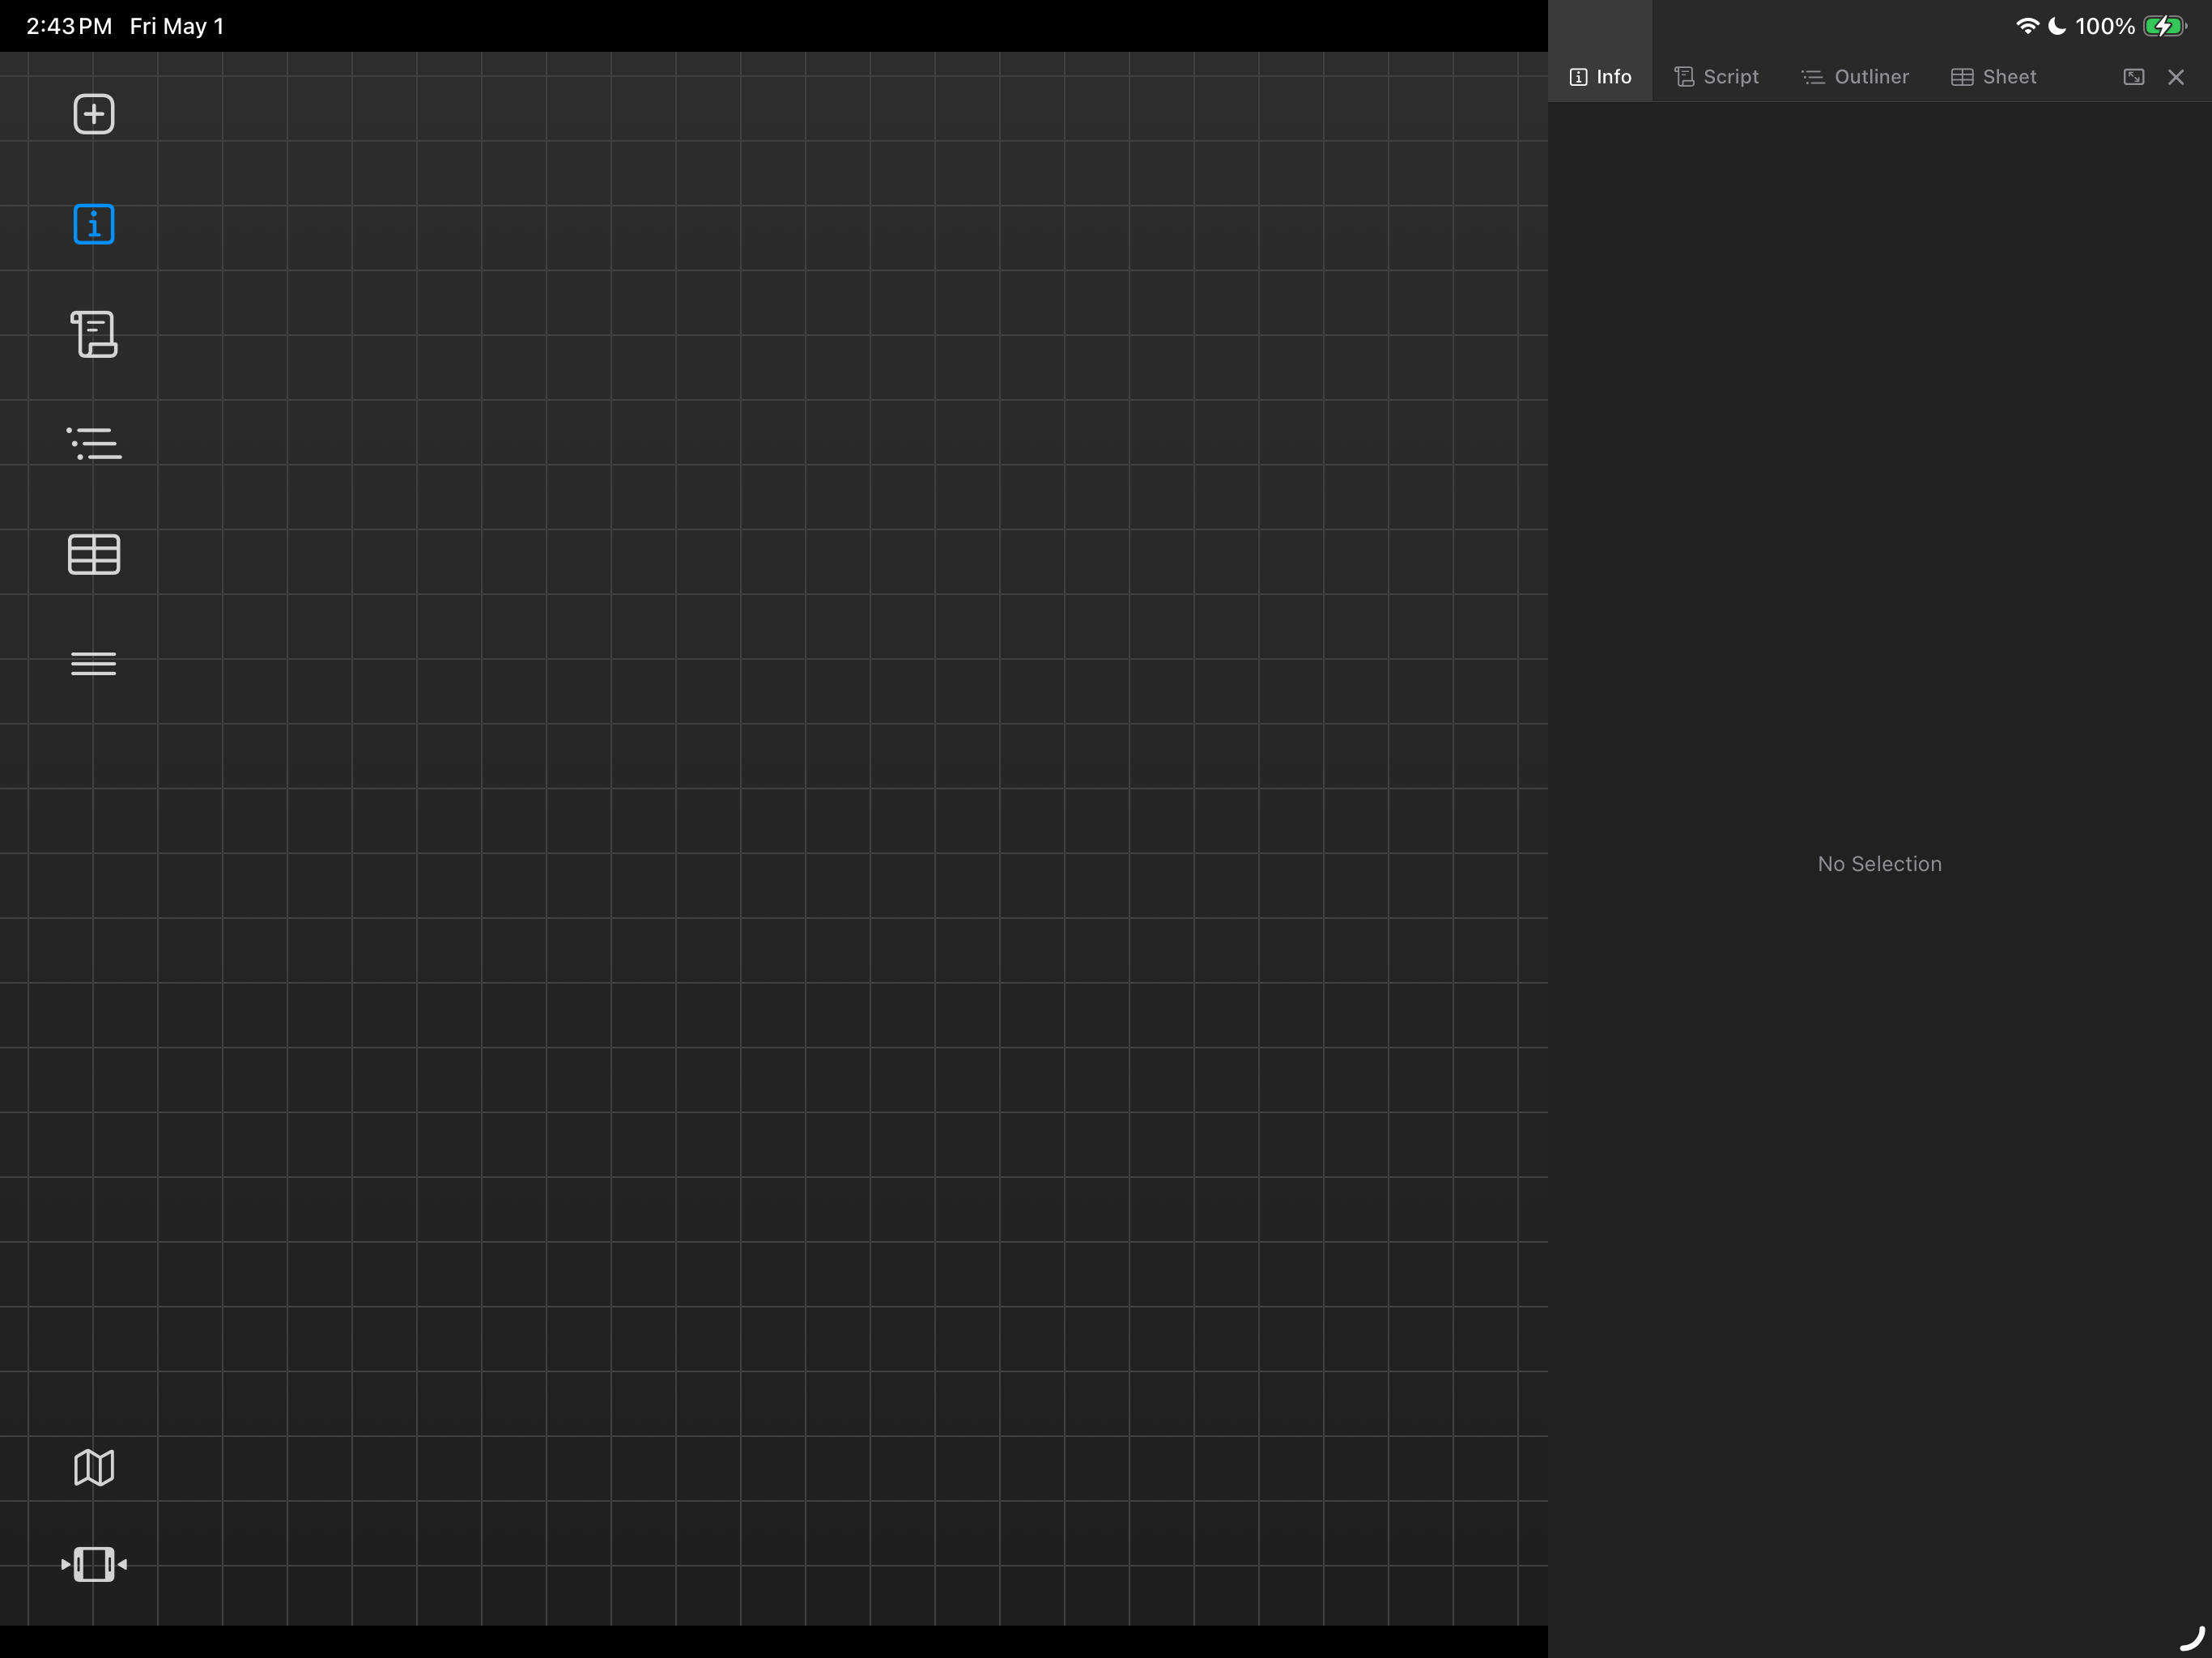
If no nodes are selected in the flow, then the Info panel is shown as empty with the text label "No Selection" displayed.
Scripts Panel
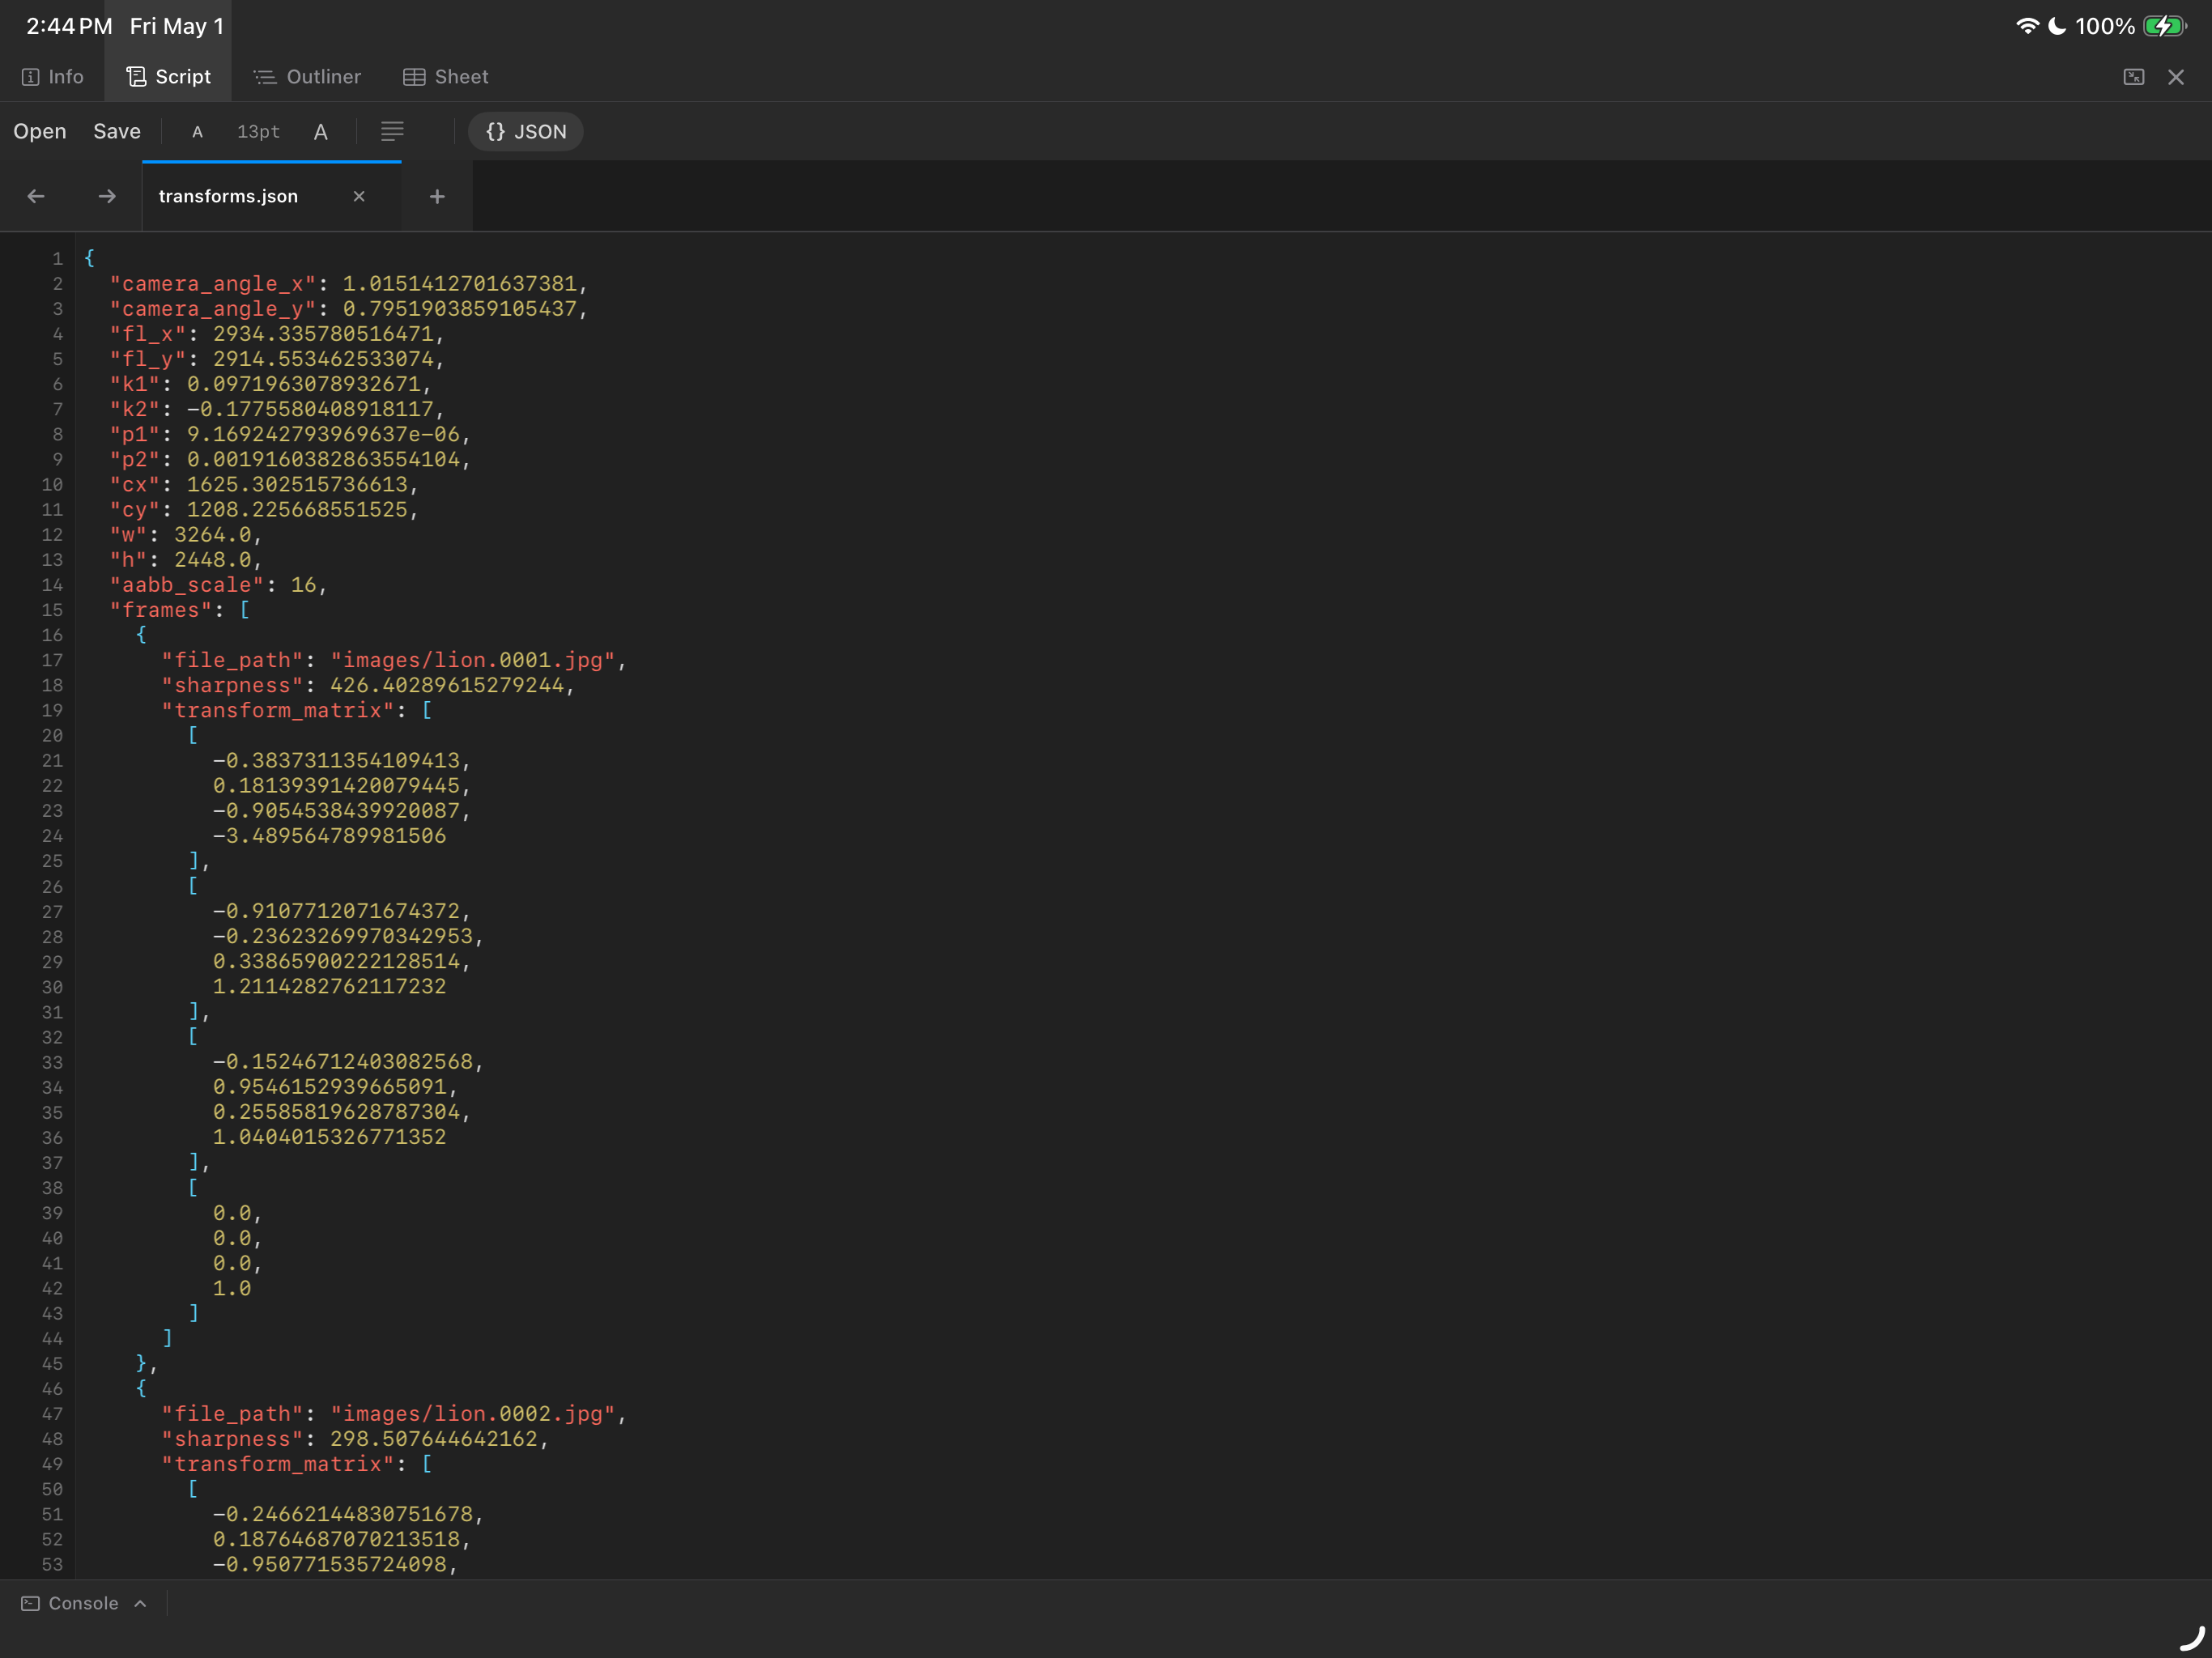
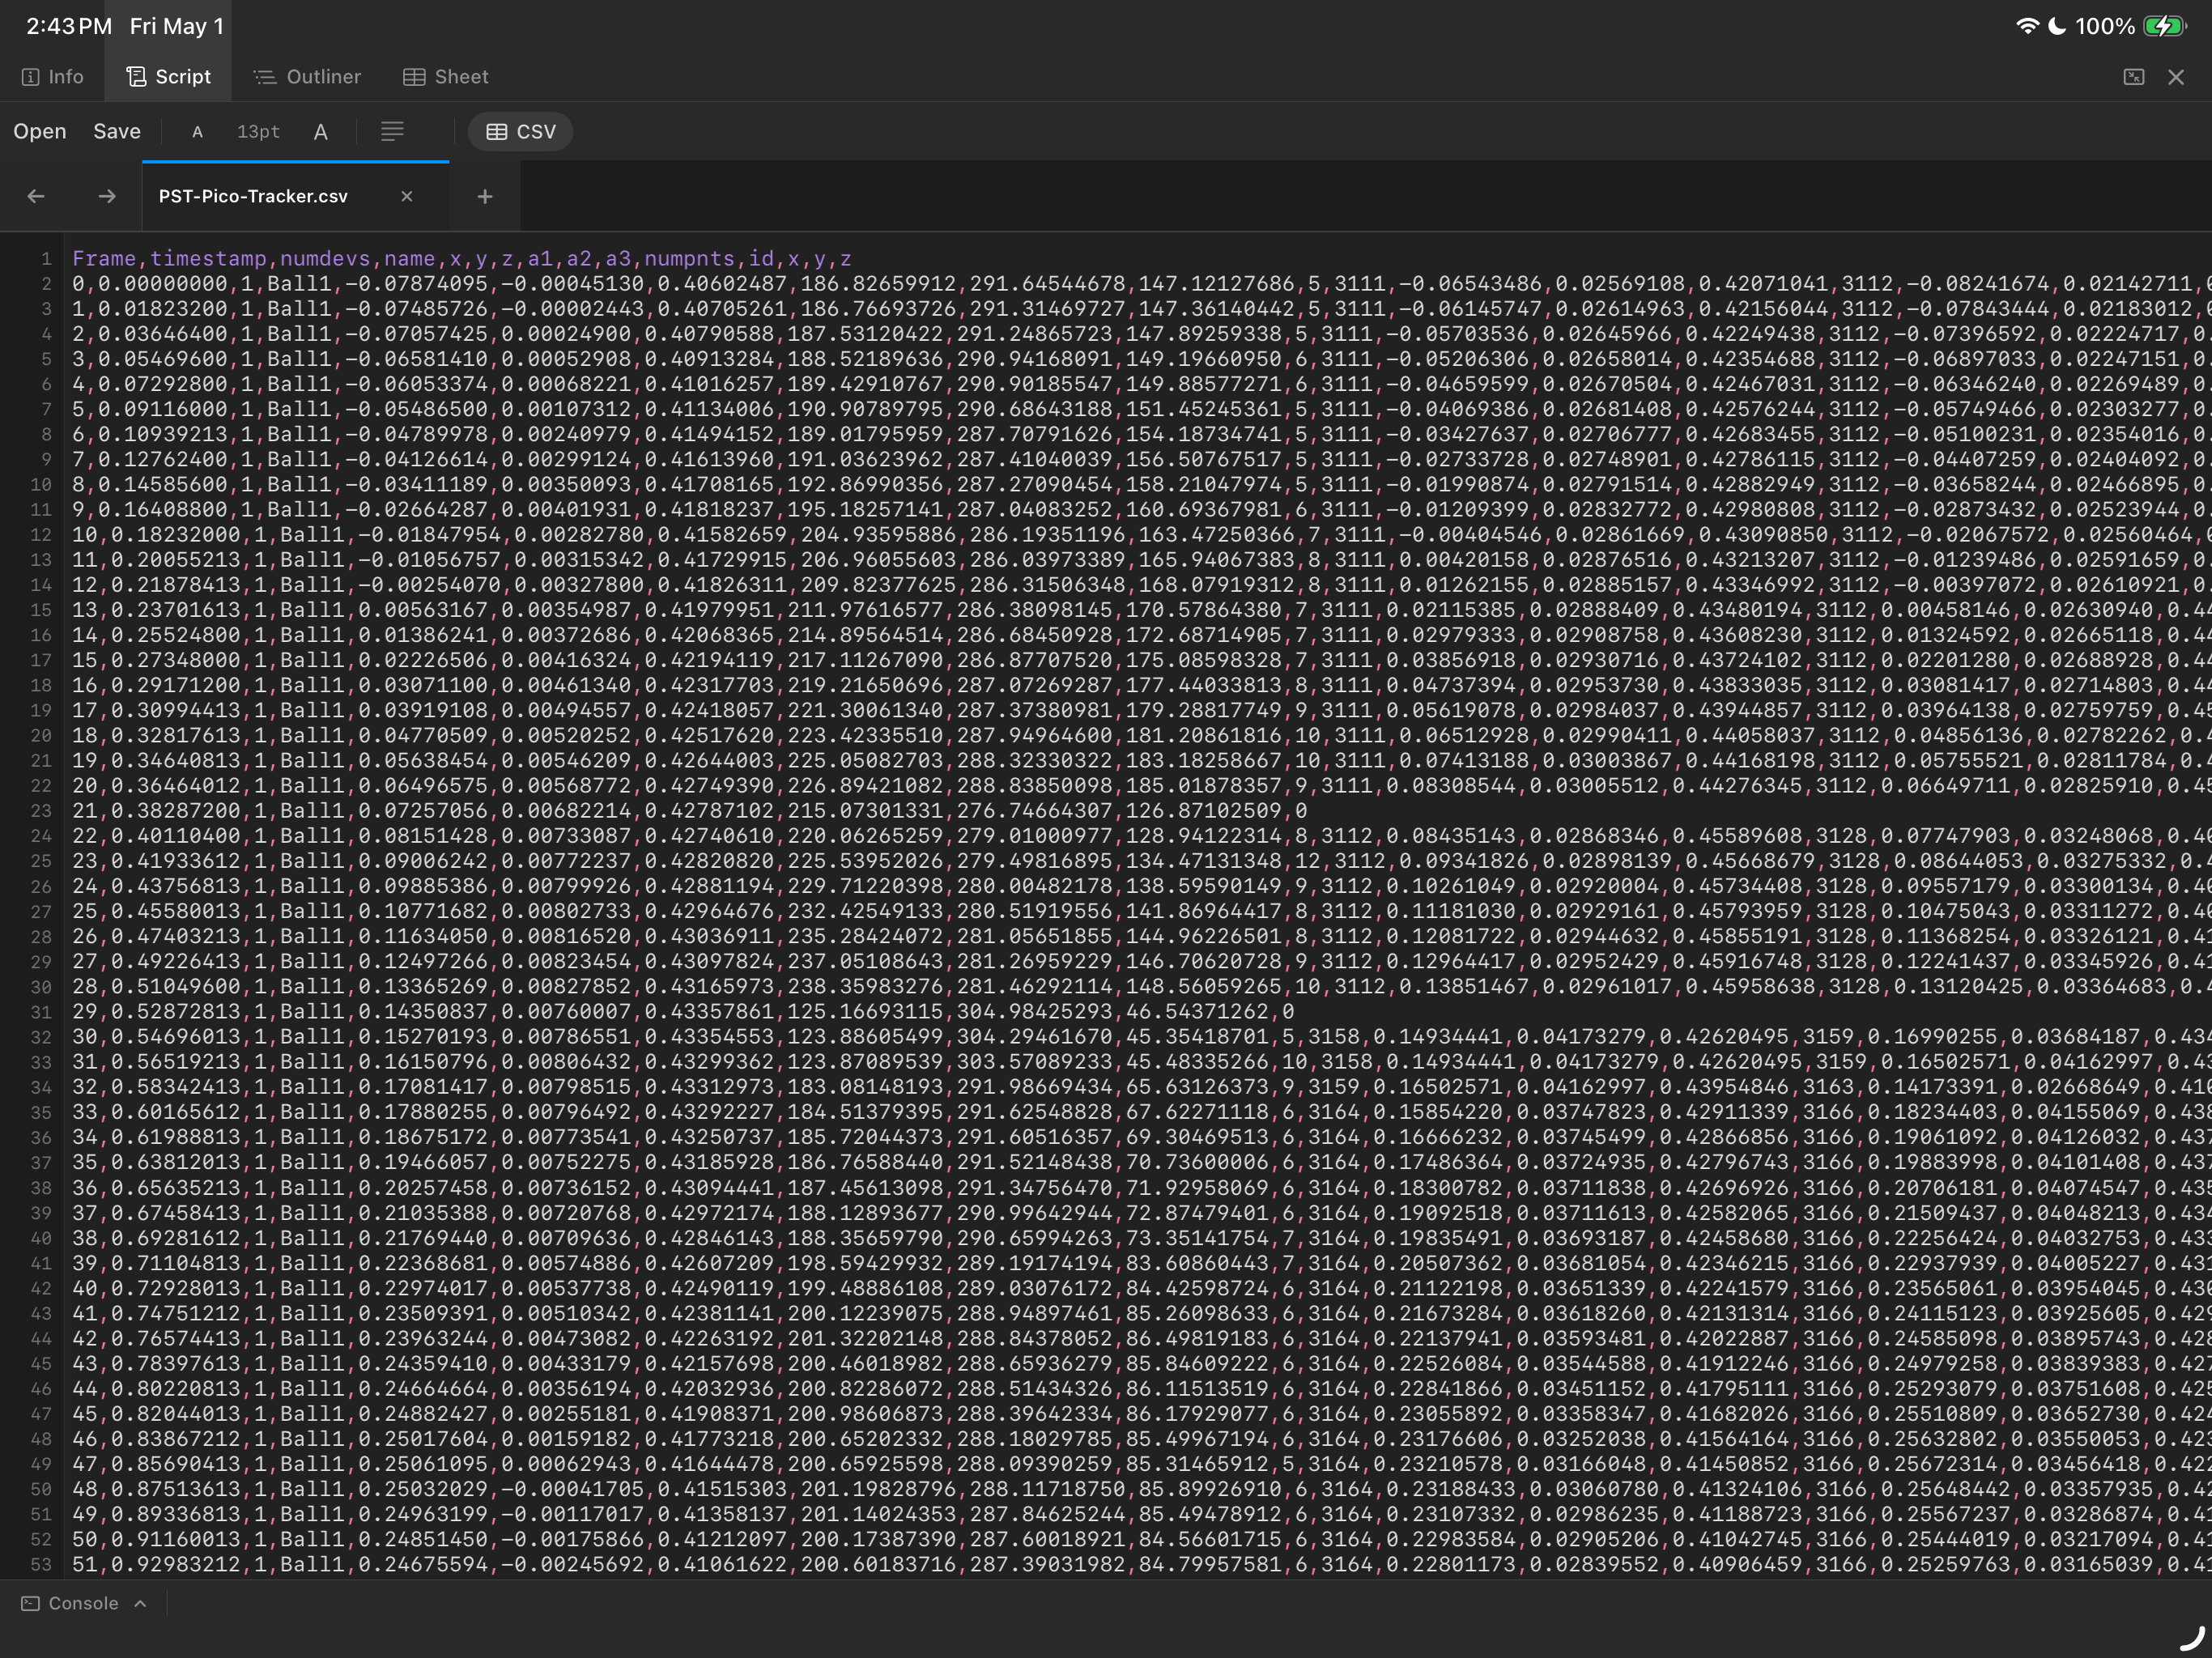
The Scripts panel supports code syntax highlighting for many common pain-text based file formats. Also, pinch-to-zoom support works in the Scripts panel.
This image shows a JSON file loaded into the Script panel.
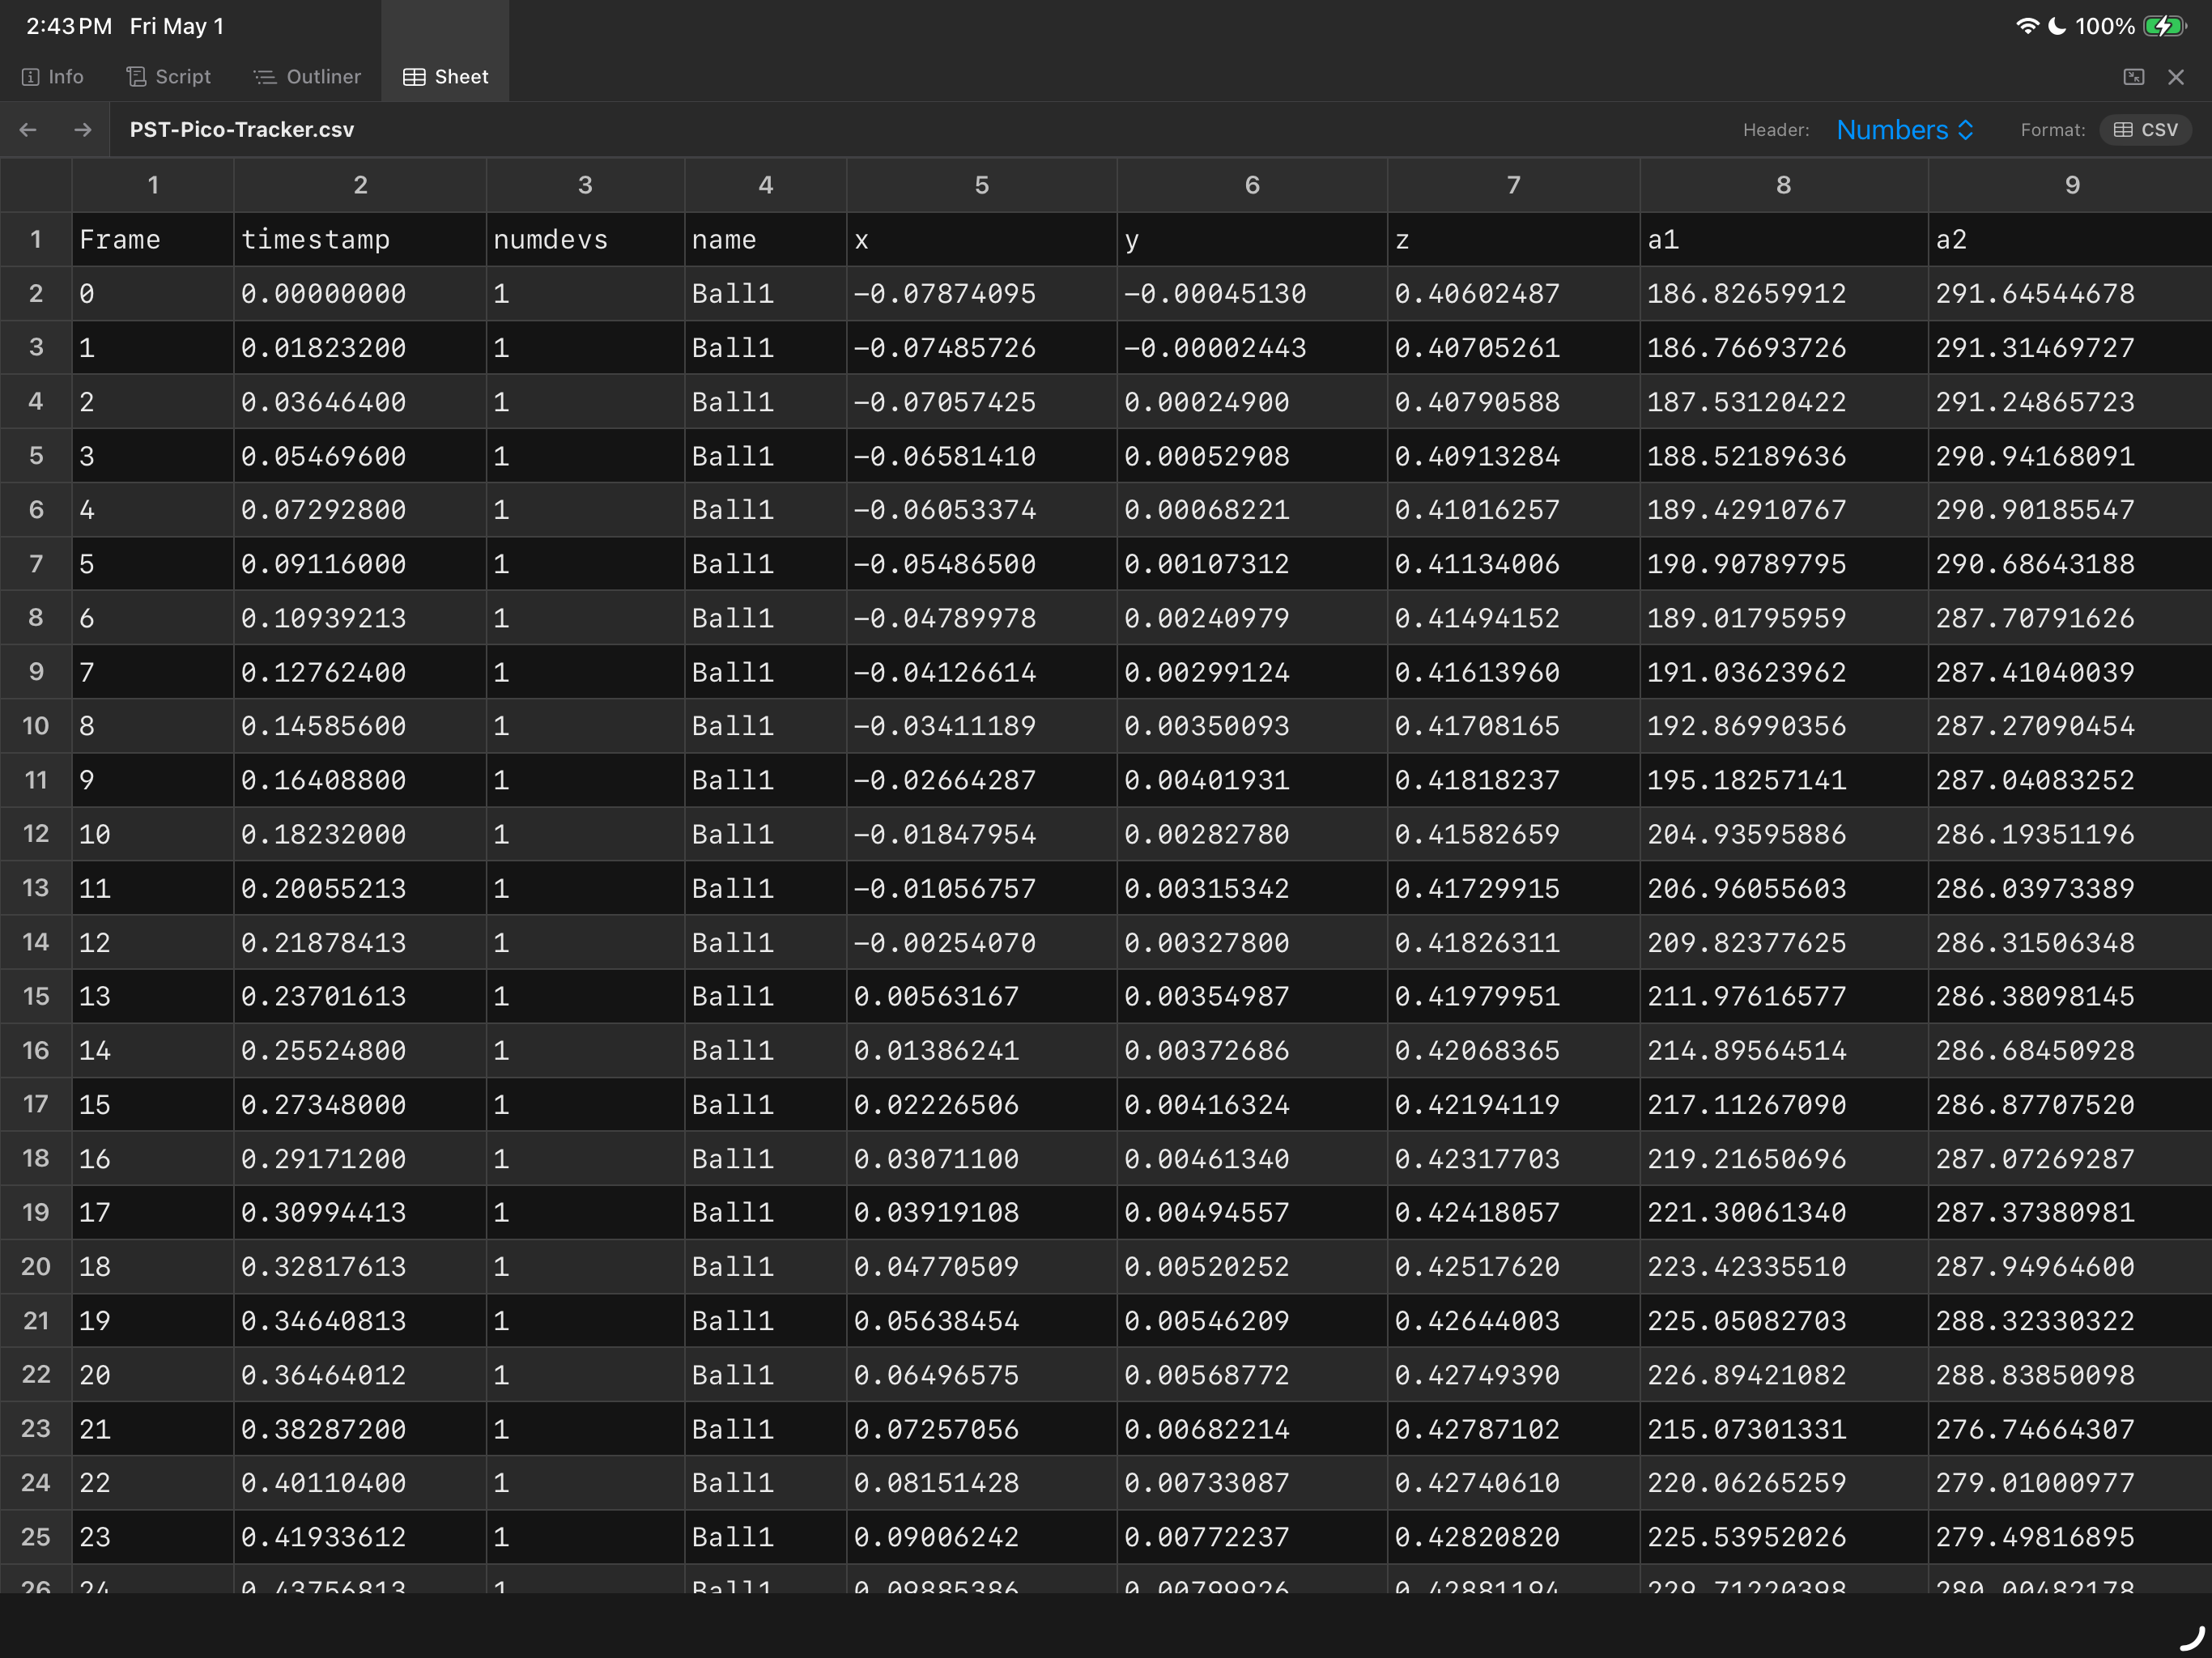
This image shows a CSV (comma separated value) spreadsheet file loaded into the Script panel.
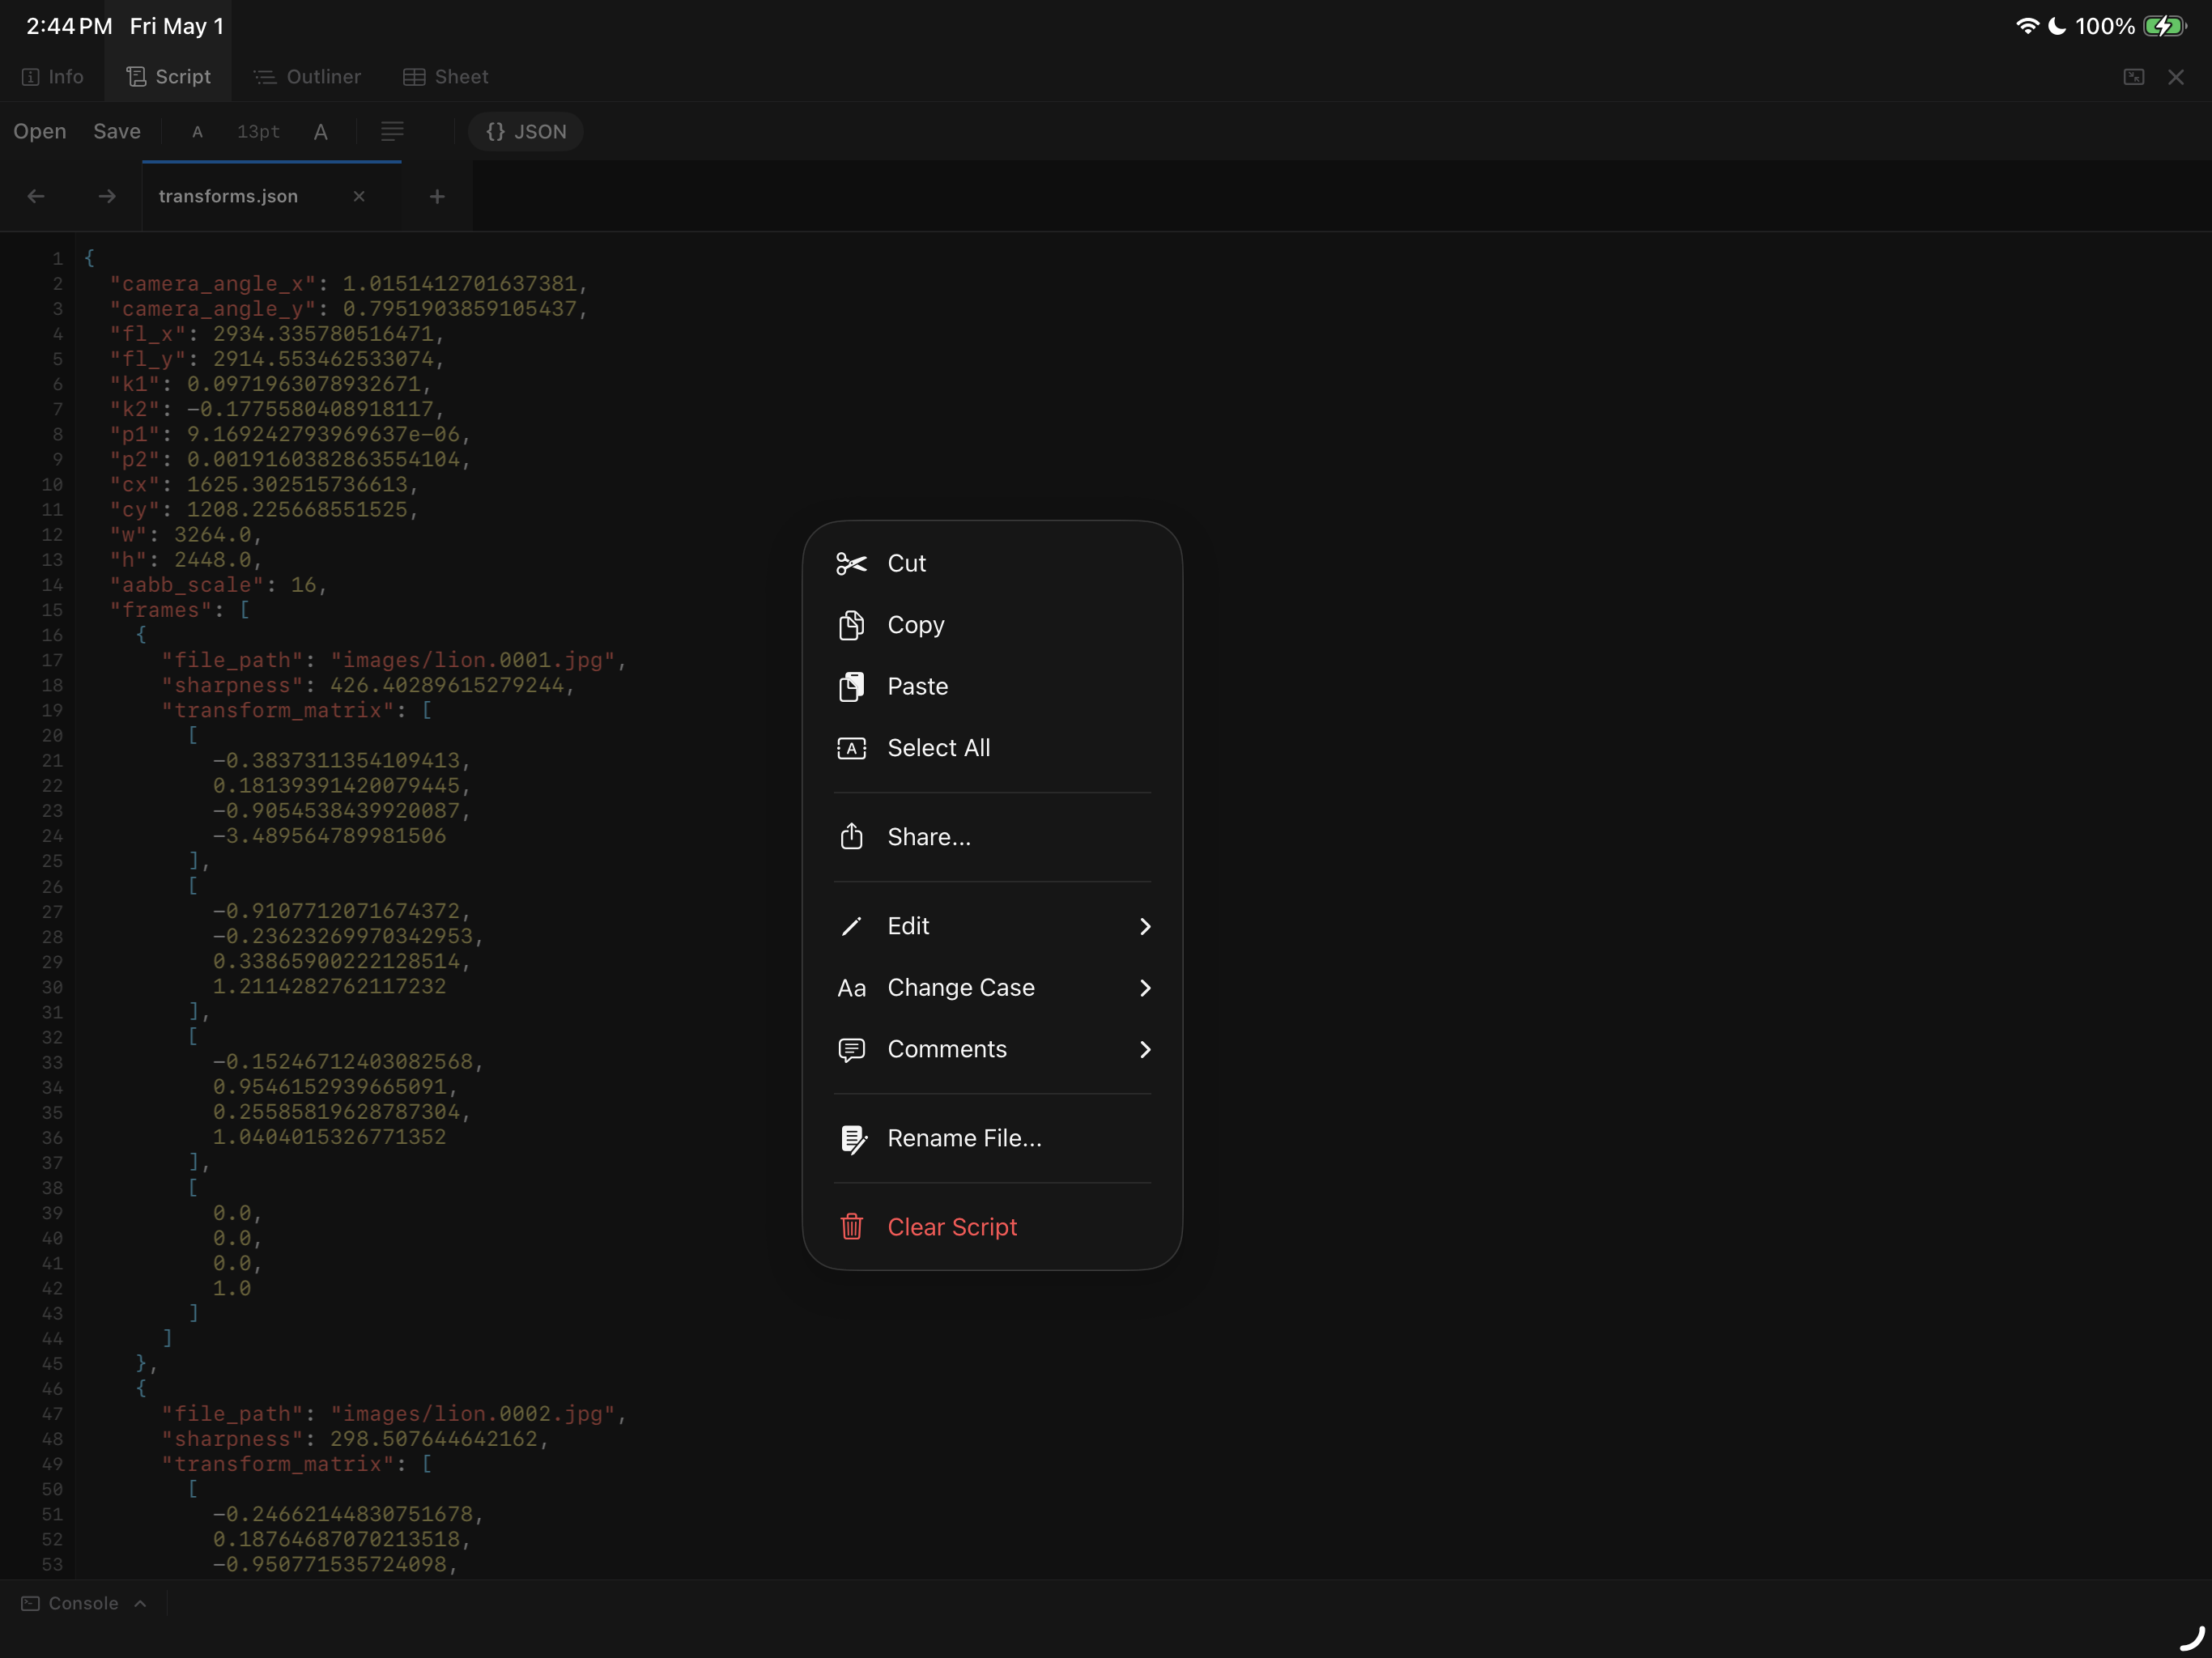
Long-pressing in the Script panel will display a context menu with text formatting and editing controls.
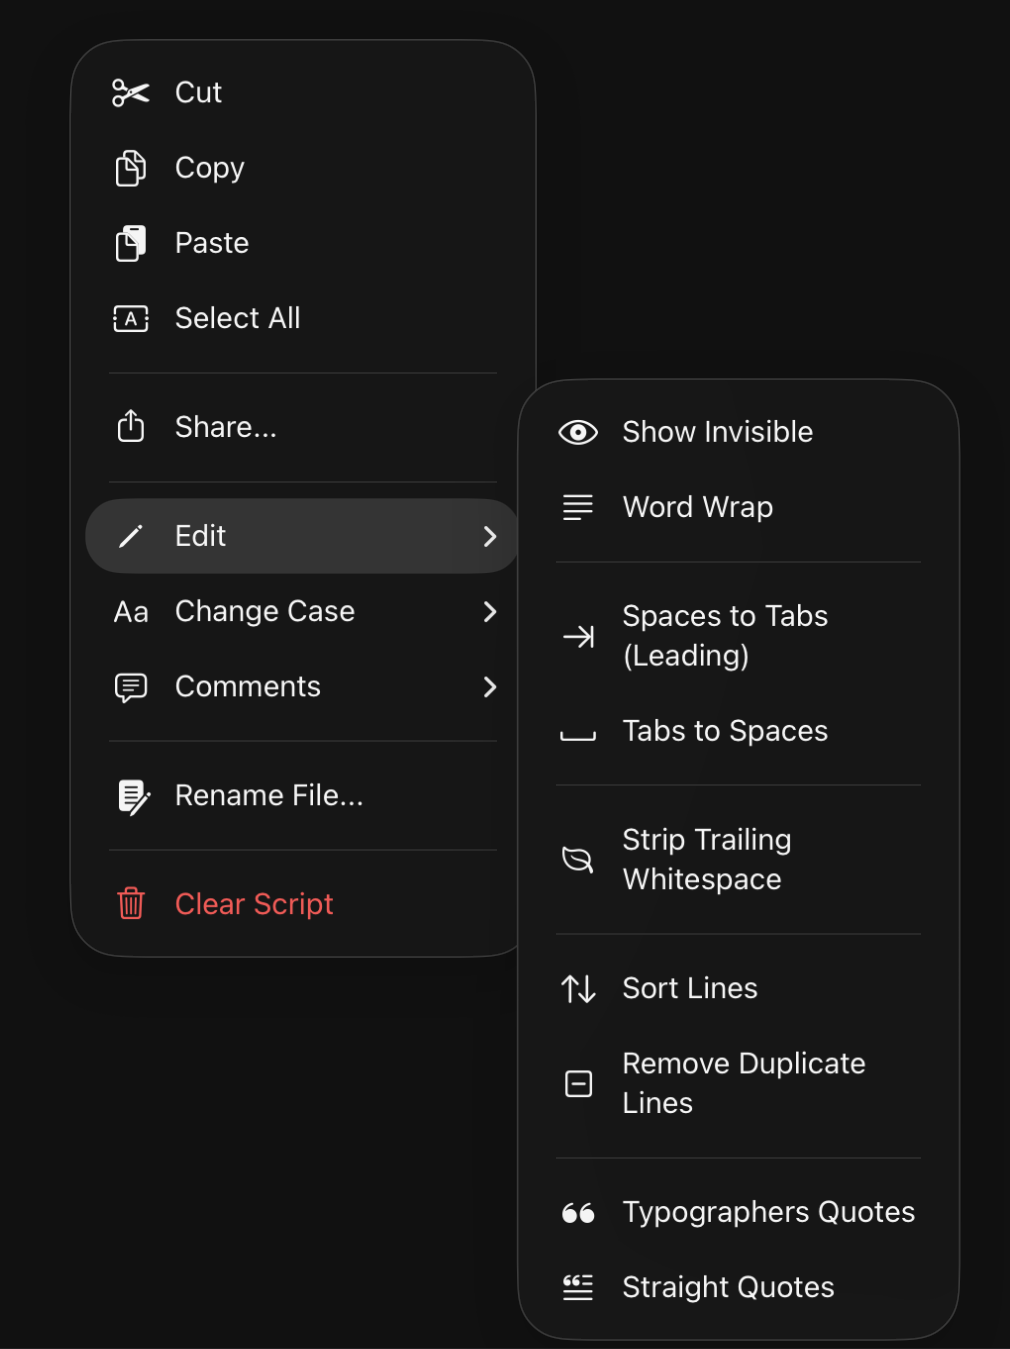
The Edit context menu has the most useful text procesing tools that can be packed into a short menu.
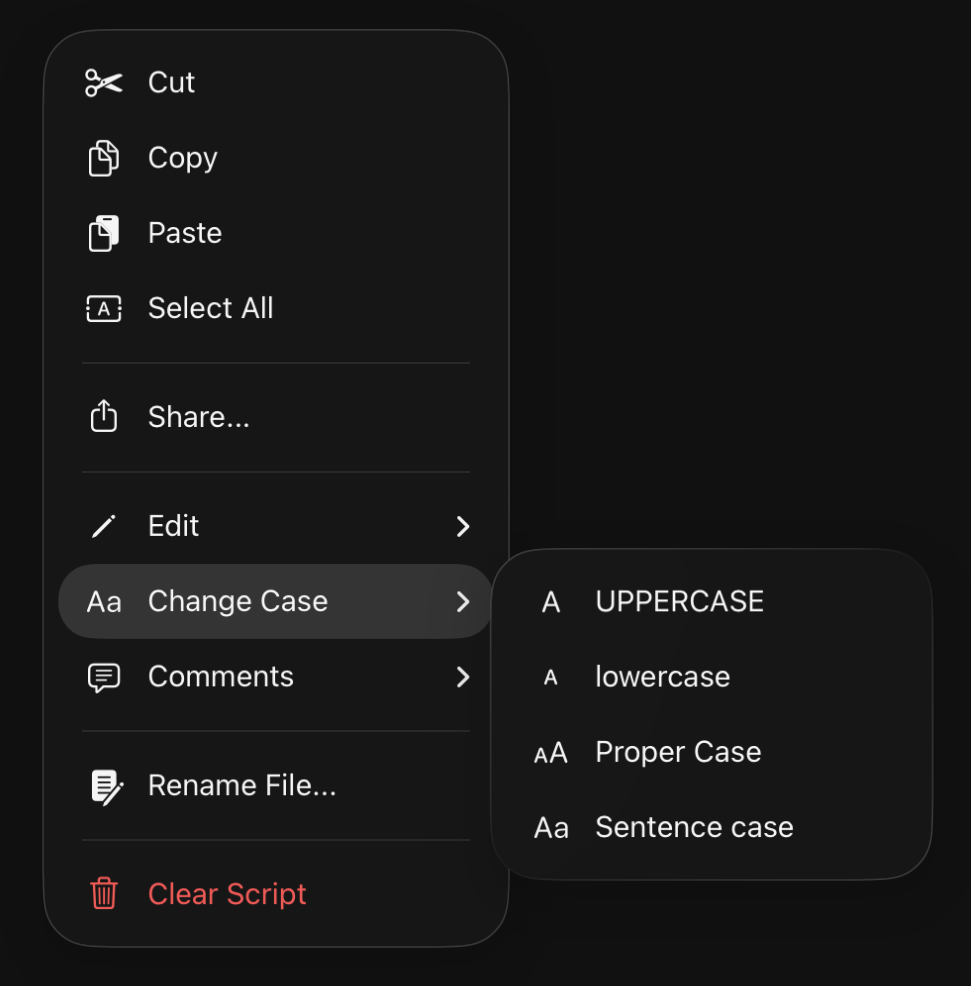
The Change Case context sub-menu works on the currently selected text in the Scripts panel.
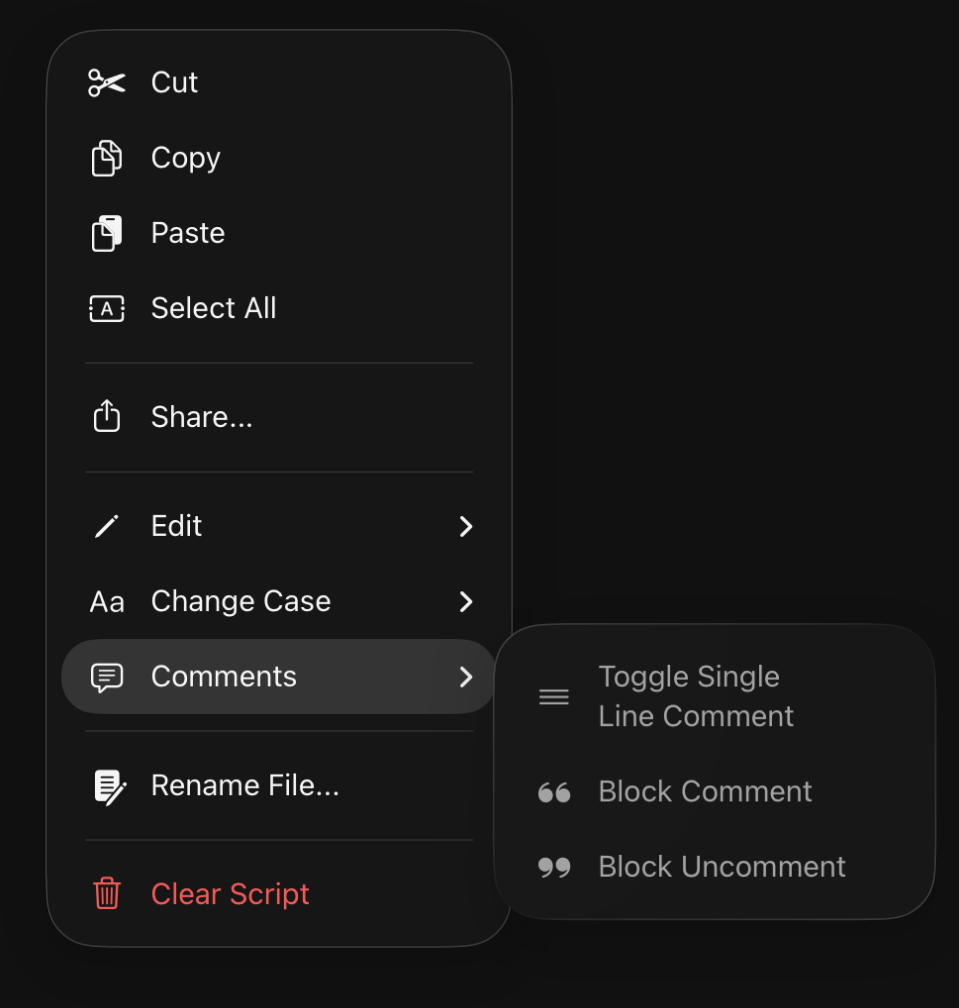
The Comments context sub-menu allows you to adjust the code commenting. The file format setting helps to align the commenting approach used for each file format.
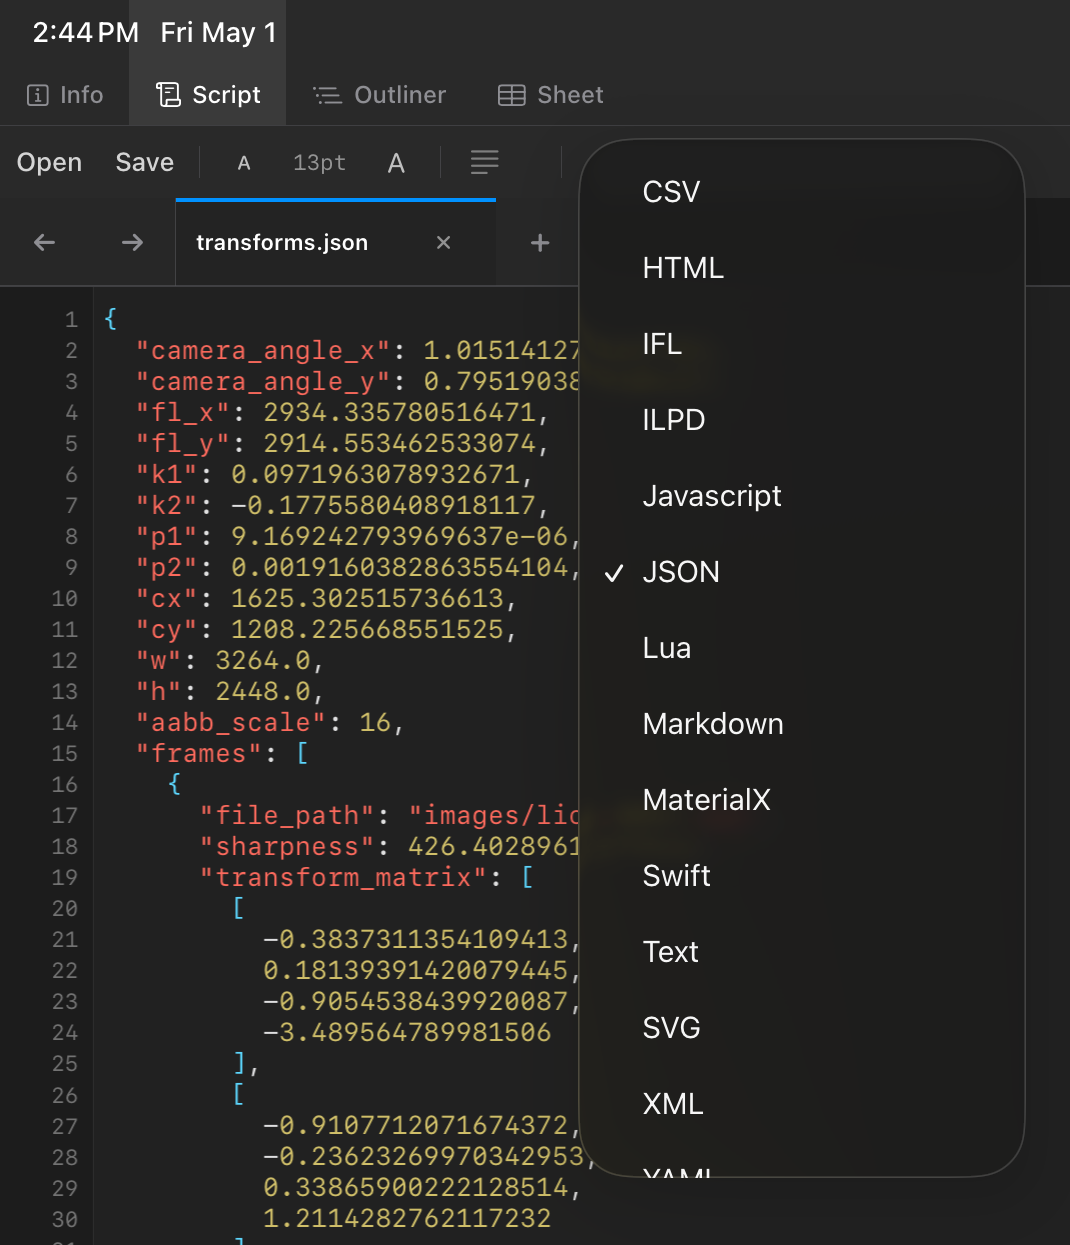
There is a document format picker control that helps change the syntax, and code formatting options.
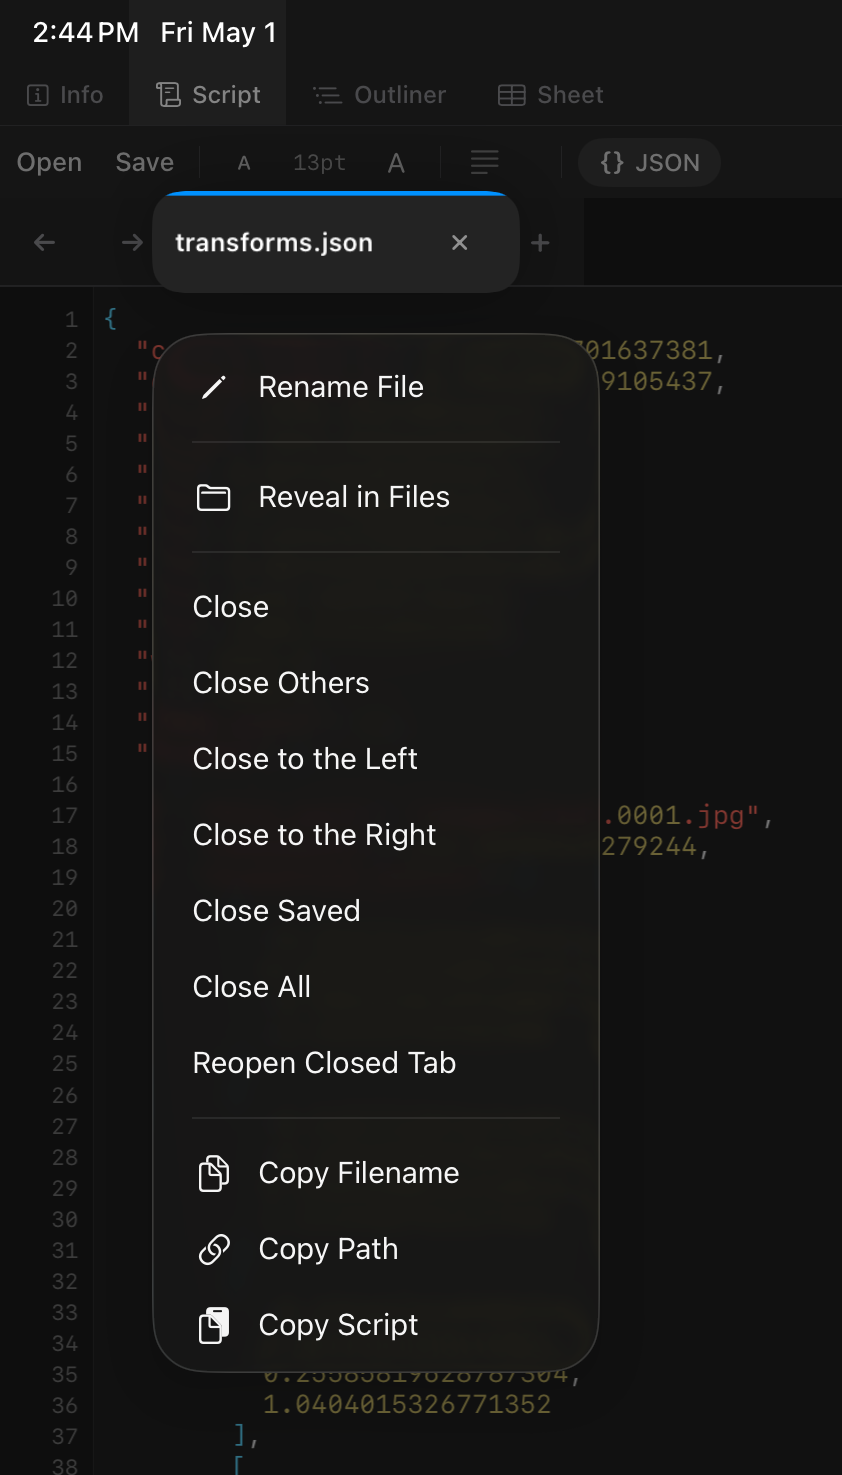
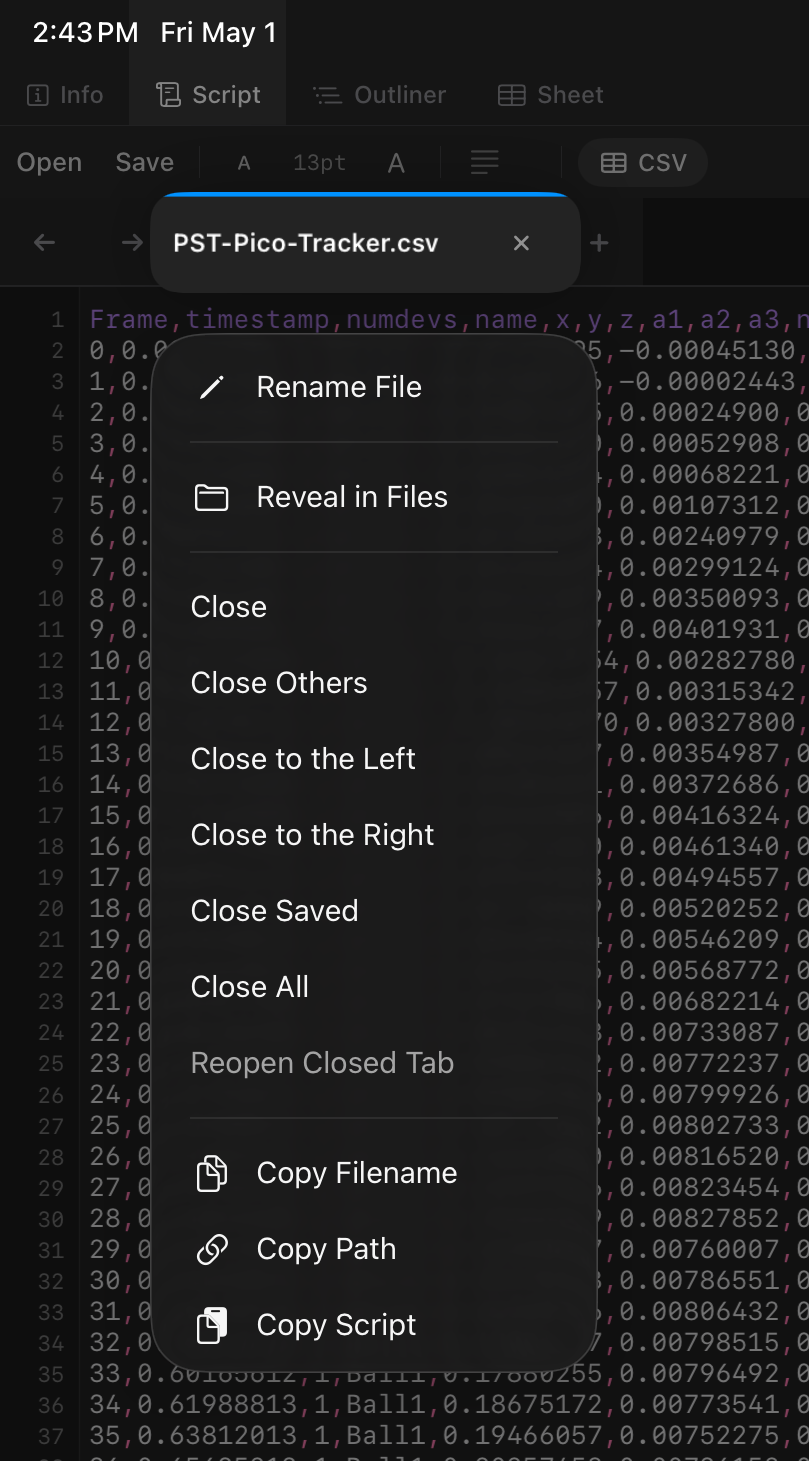
If you long-press on the Script panel's filename tab for a document you get a context menu with tab and file based options. This works with all of the visible Script panel tabs that exist.
Sheet Panel
Long-pressing on a column heading shows a menu with options to modify the spreadsheet.
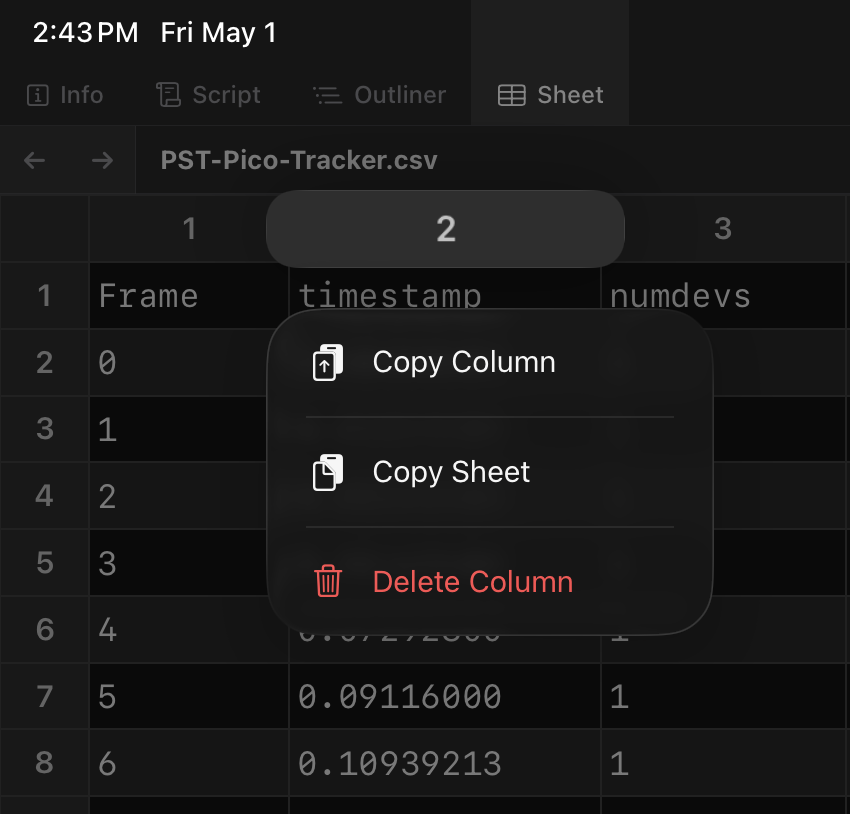
The sheets view can be maximized to use the full viewable area on the monitor. The sheet based filename is listed on the tab at the top.
Outliner Panel
The outliner shows an object model hiearchy view for file formats like JSON, YAML, and XML. When exploring the outliner strucutre, nested items can be expand or folded.
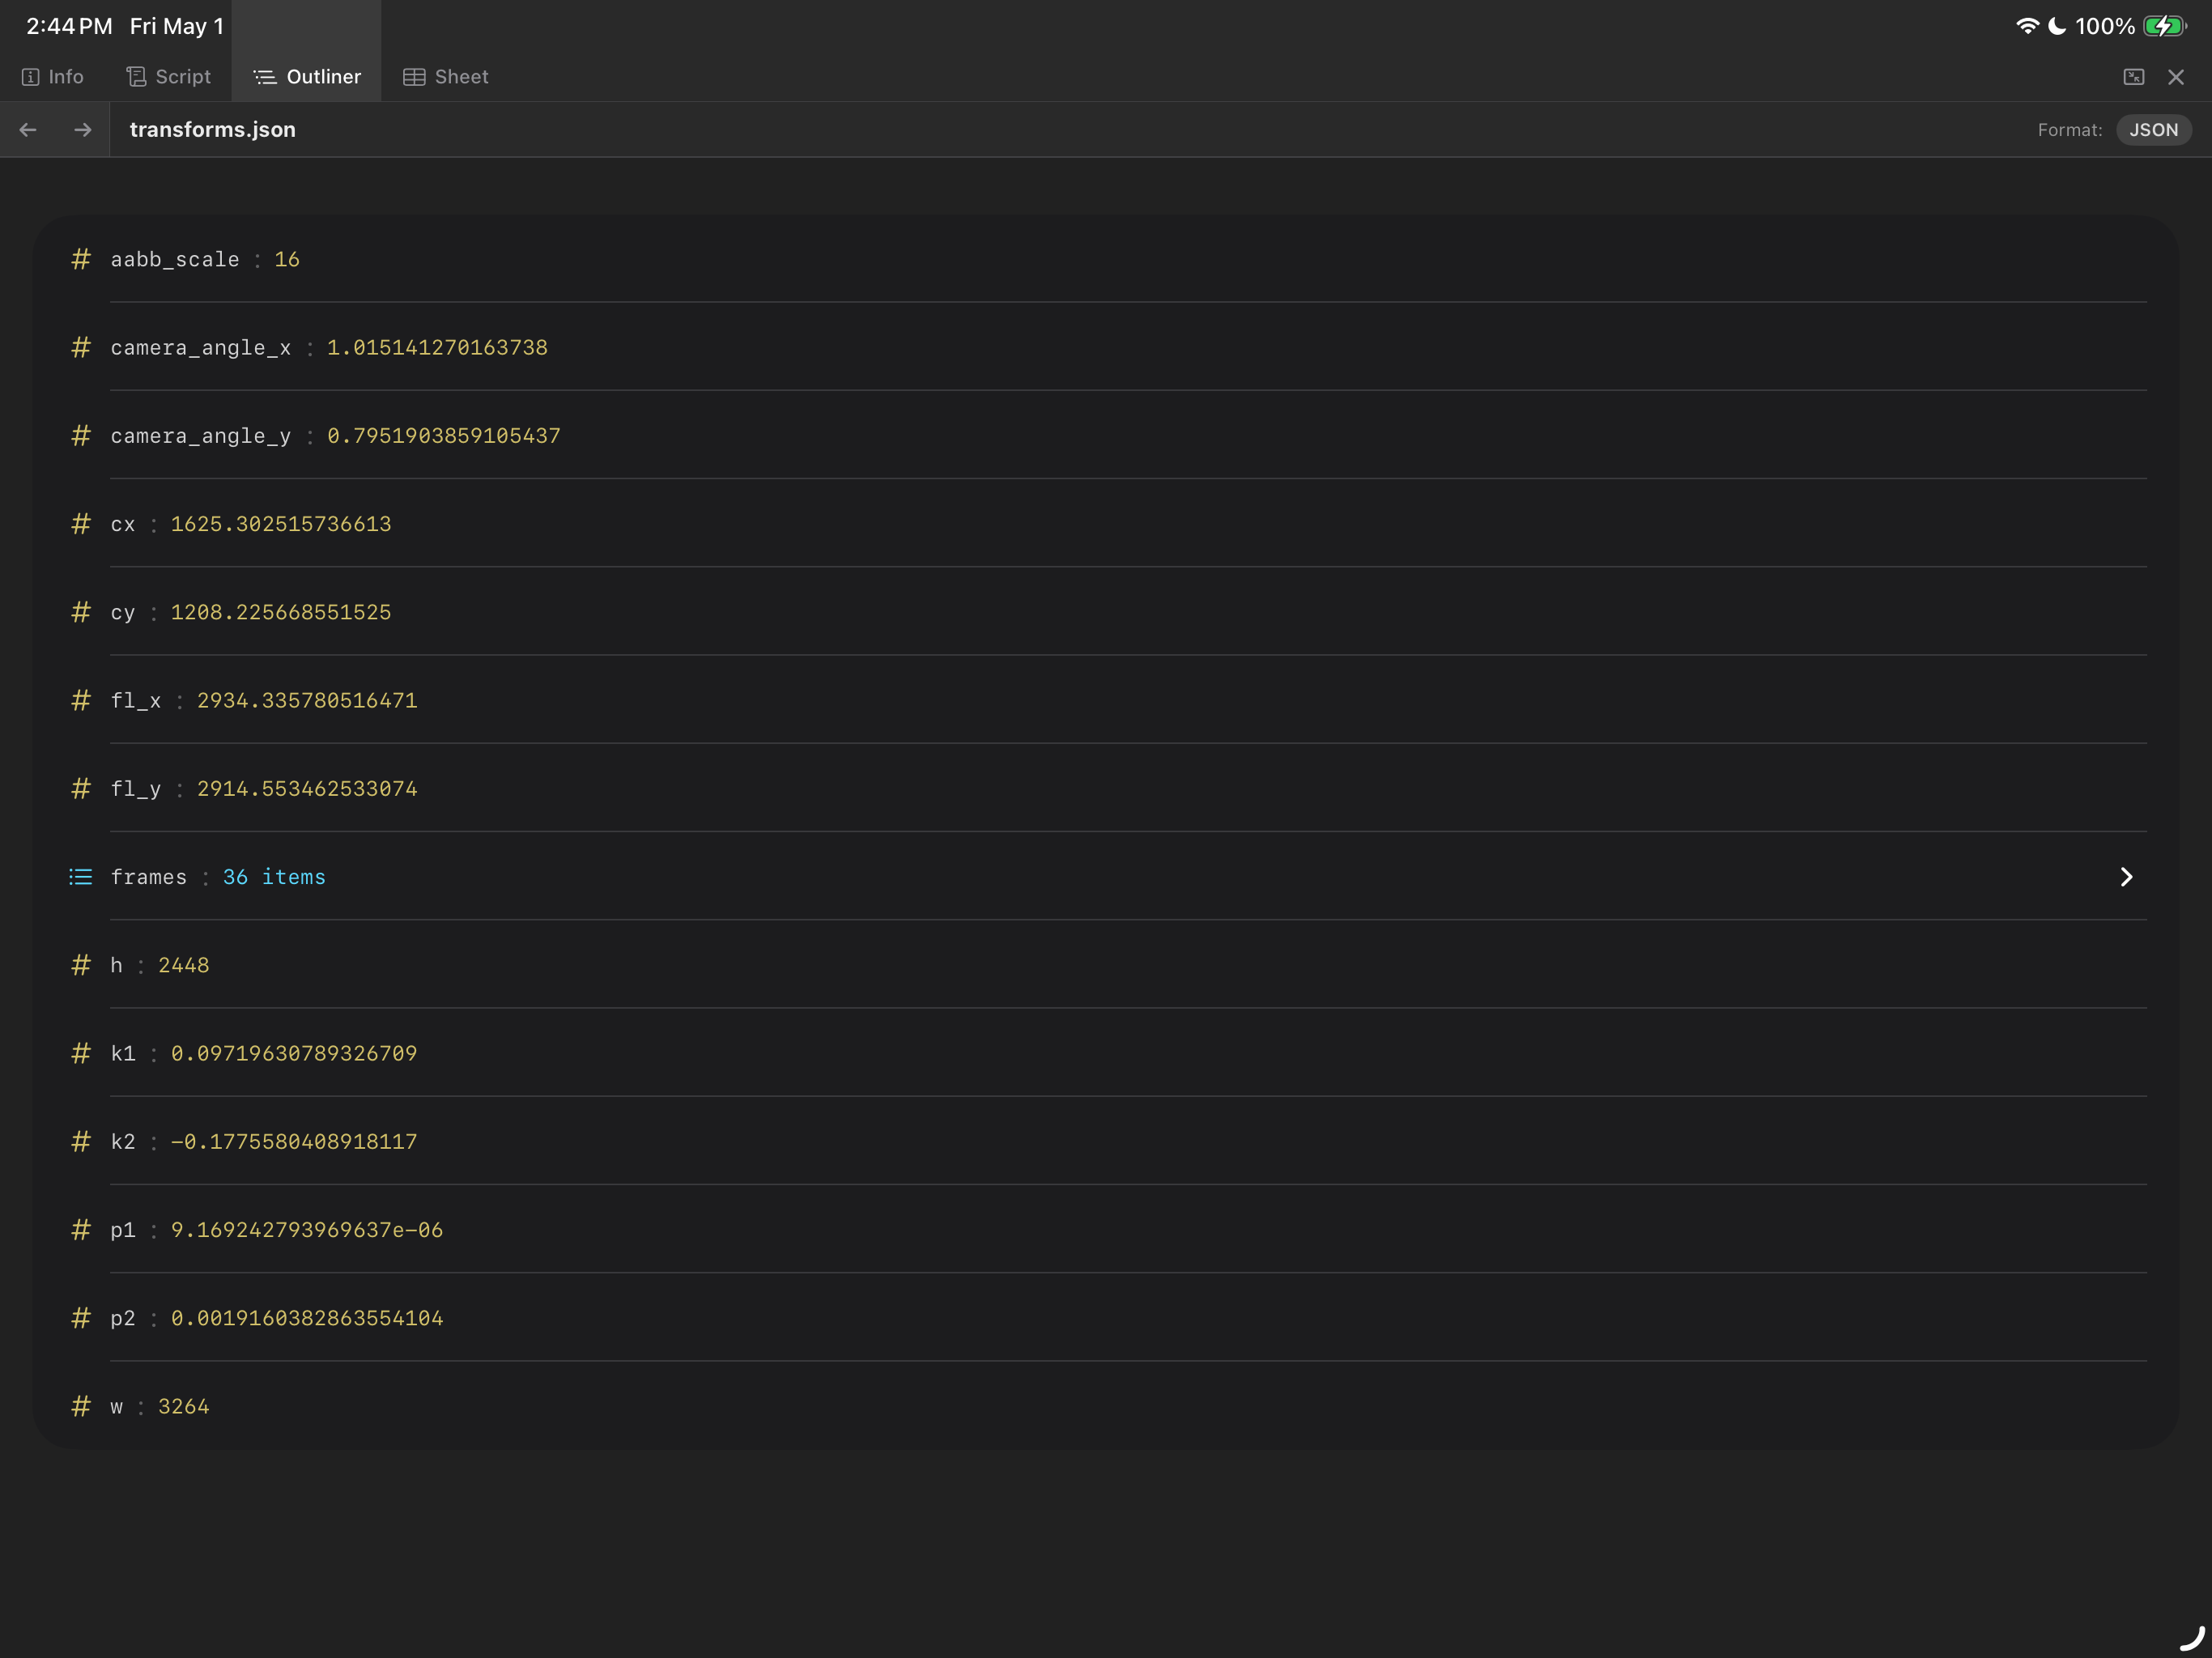
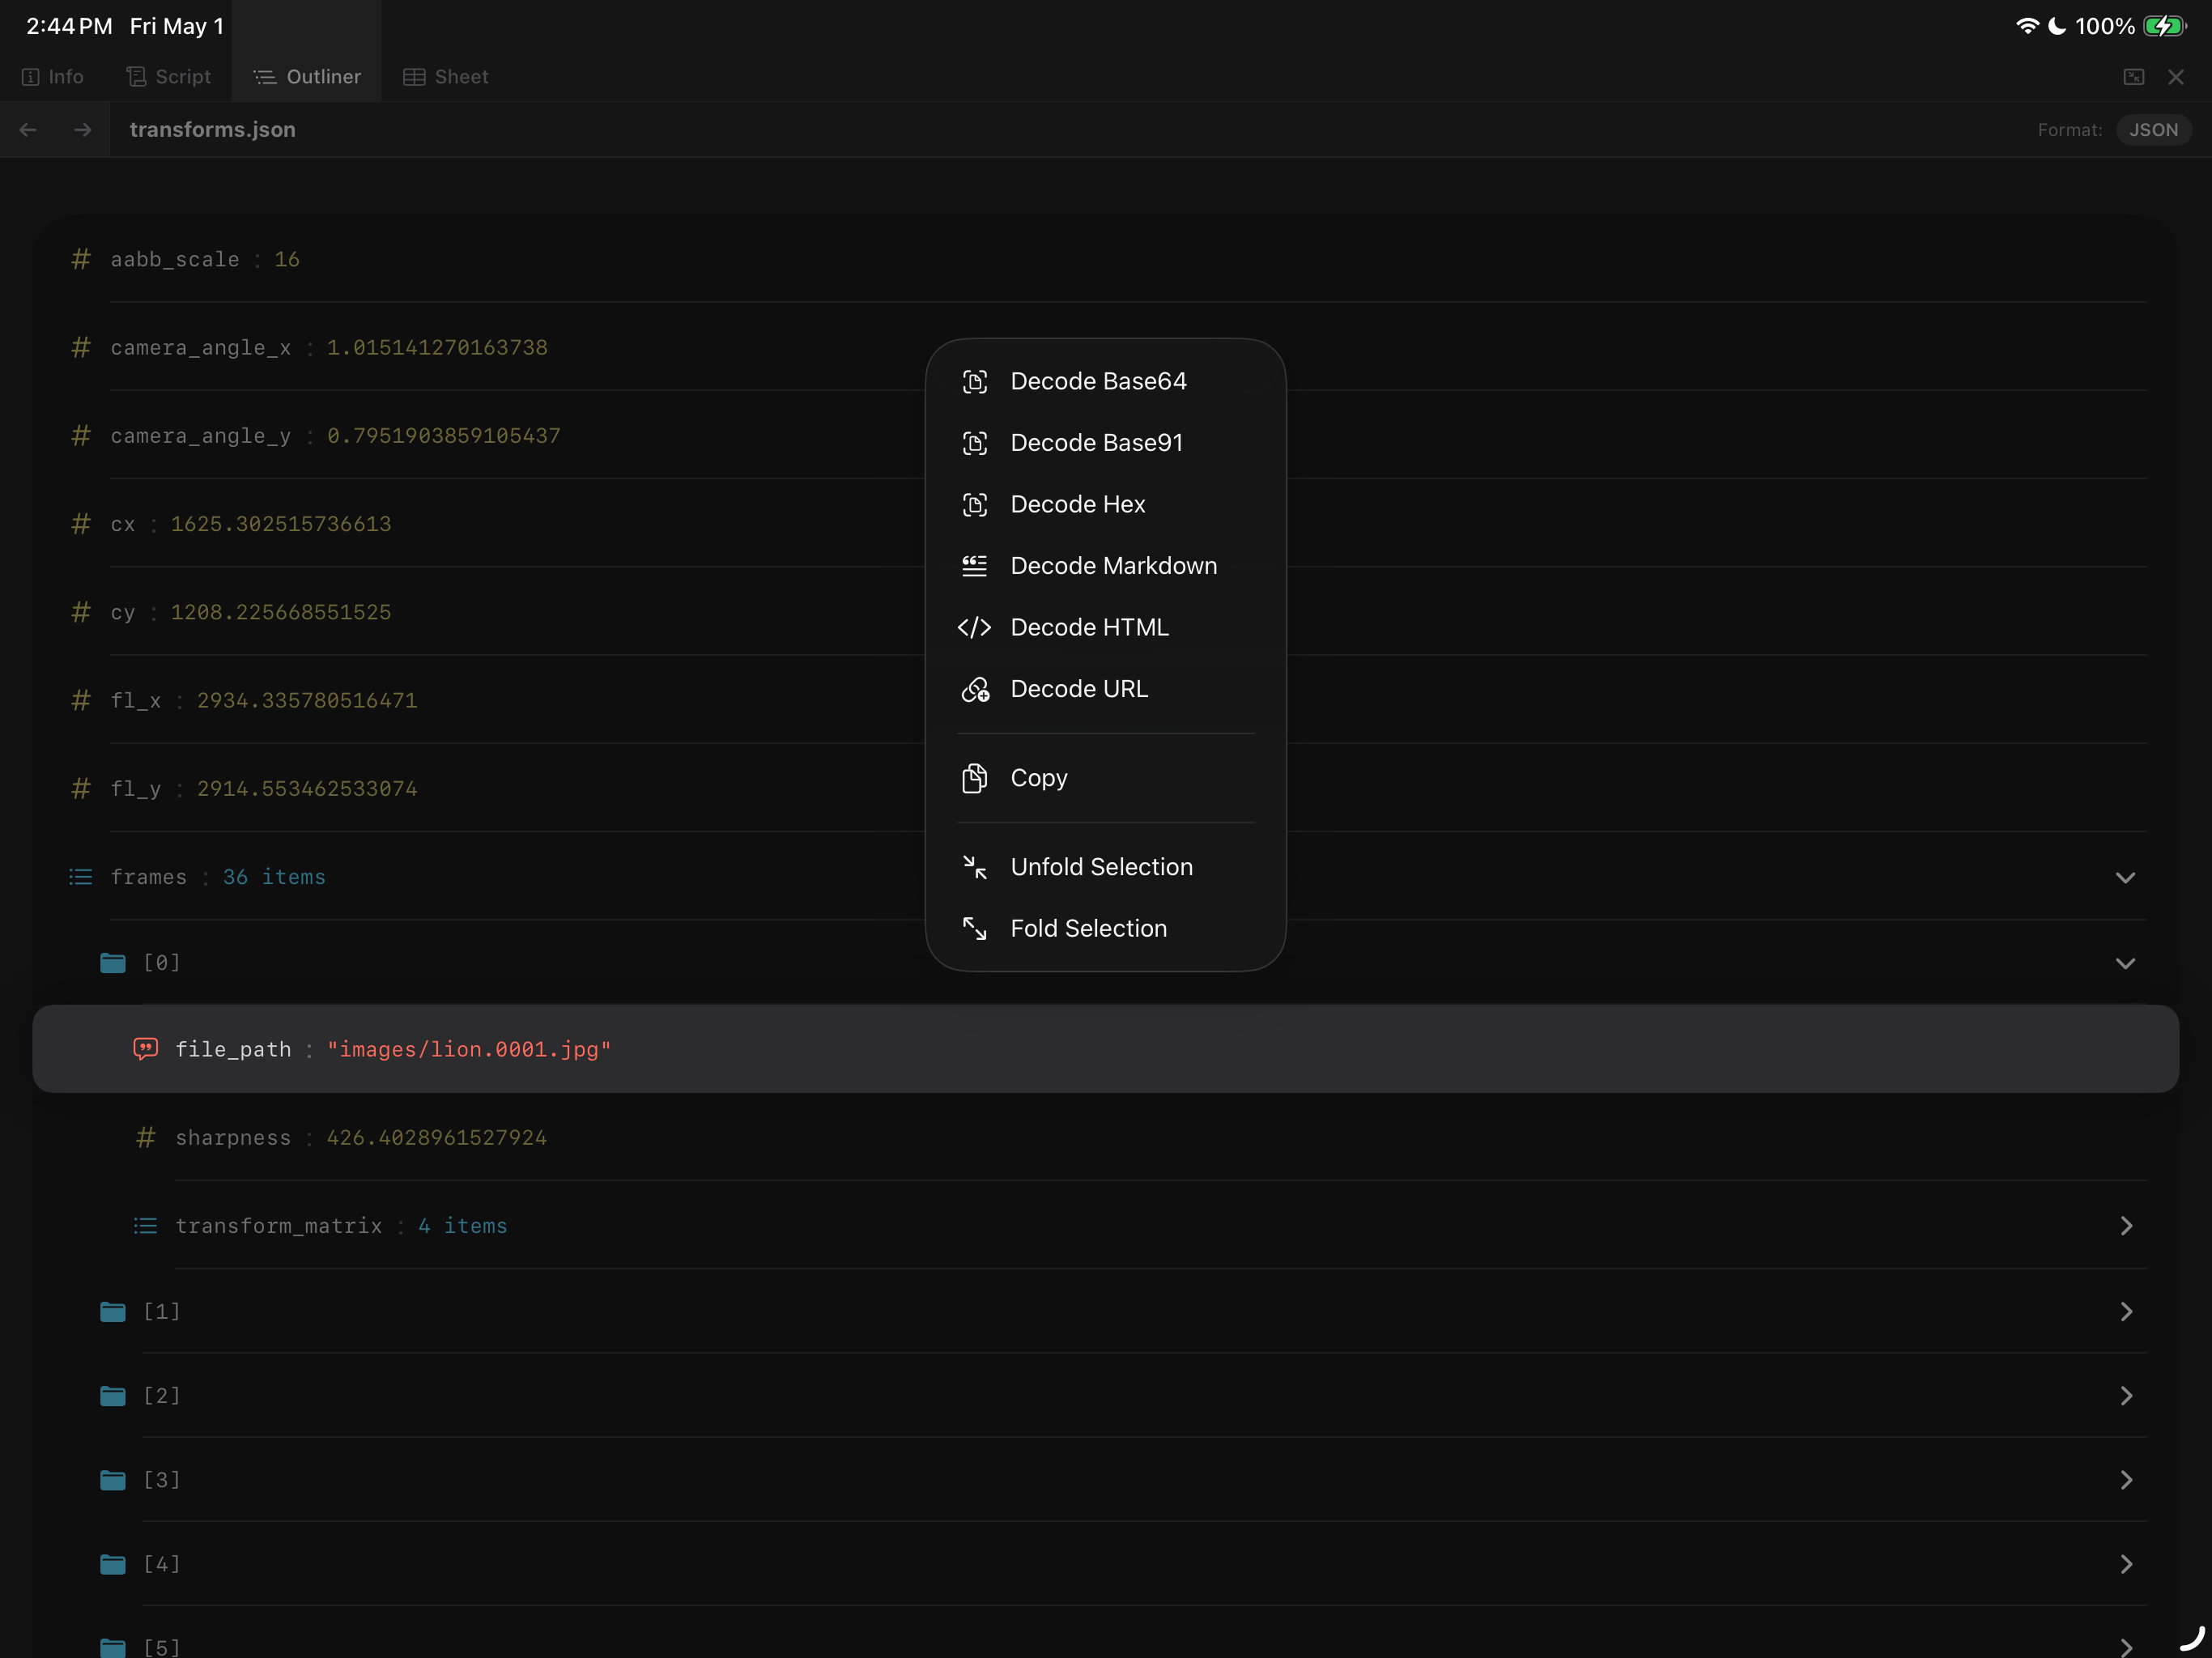
A long-press context menu can be displayed in the Outliner panel. This context menu can fold/unfold array sub-elements. You can also decode certain data types in the Ouliner to make it easier to diagnose what the data is indicating.
Long-pressing on an item in the Outliner, allows you acess to the "Copy" menu item command, among several other options. If you have a Markdown format document open, the "Decode Markdown" command shows the markdown to HTML rendered content in the view.