vArrayShapeRender
The final render node — takes a projected point array and draws shapes, lines, and custom geometry at every position.
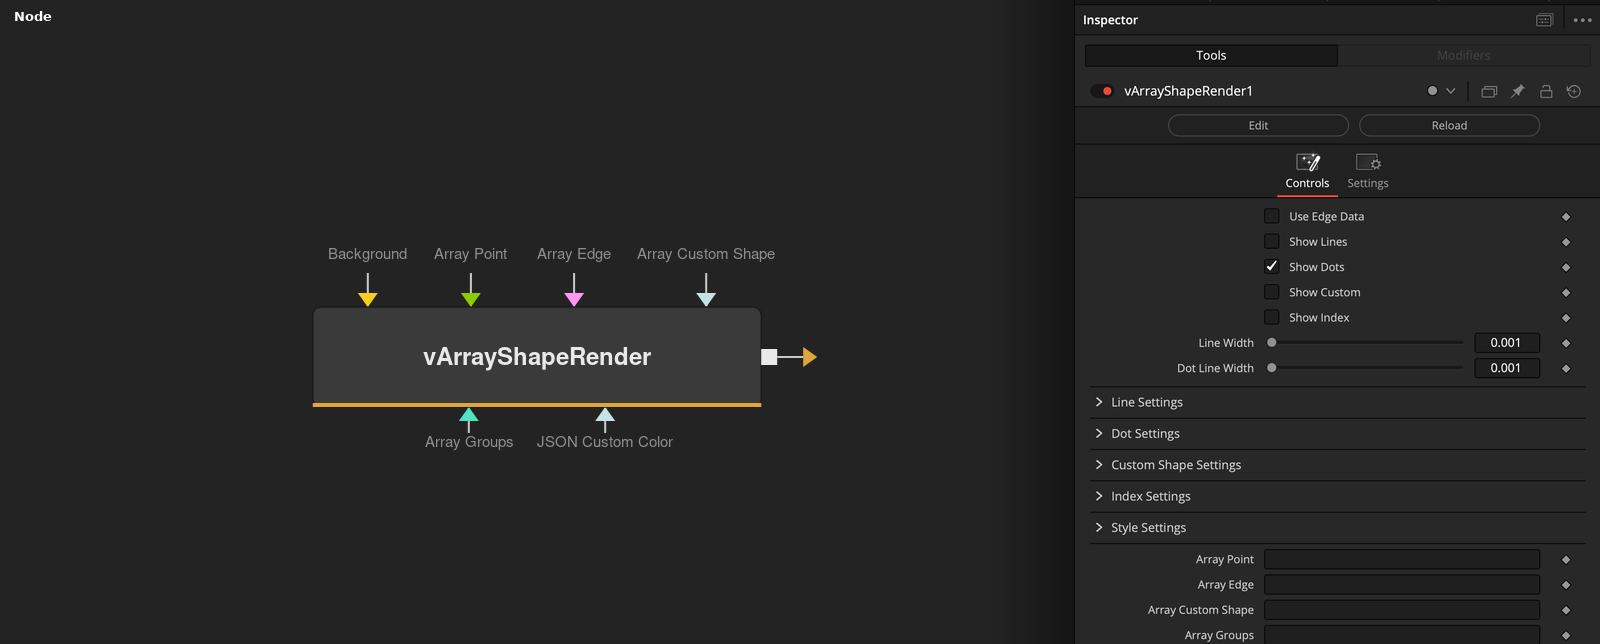
vArrayShapeRender is the terminal node in every vArray pipeline. It reads an array of projected 2D screen-space positions and renders configurable shapes — dots, lines, custom polygons, or text paths — at each point, composited over a background image.
Parameters
| Parameter | Type | Default | Description |
|---|---|---|---|
| Use Edge Data | Checkbox | Off | When enabled, line connections are drawn using the explicit edge pairs from the ArrayEdge input rather than connecting sequential points. |
| Show Lines | Checkbox | Off | Toggles the line layer. When enabled, lines are drawn between points using the Line Width and Line Color settings. |
| Show Dots | Checkbox | On | Toggles the dot layer. Dots are rendered at each point position using Dot Sides, Dot Radius, and Dot Color. |
| Show Custom | Checkbox | Off | Toggles the custom shape layer. Renders shapes from the ArrayShape input at each point position. |
| Show Index | Checkbox | Off | Renders the array index number at each point position. Useful for debugging pipelines and understanding point ordering. |
+29 more parameters
| Parameter | Type | Default | Description |
|---|---|---|---|
| Line Width | Float | 0.001 | Stroke width of connecting lines in normalised units. Scale relative to composition size. |
| Dot Line Width | Float | 0.001 | Stroke width of the dot outline when Render Outline Dots is enabled. |
| Connect Text Groups | Checkbox | Off | When enabled, line connections are drawn between points within each text group from the ArrayGroups input. |
| Render Outline Lines | Checkbox | On | Enables stroke rendering for the line layer. Disable for a filled-only line appearance. |
| Line Color | Color | 0, 1, 1, 1 | RGBA colour applied to all rendered lines. |
| Hide Default Dots | Checkbox | Off | Hides the default circular dot shape at each point, while still allowing custom shapes or lines to render. |
| Render Outline Dots | Checkbox | Off | Renders a stroke outline around each dot in addition to the fill. |
| Dot Sides | Integer | 6 | Number of polygon sides for each dot. 3 = triangle, 4 = square, 6 = hexagon, 32+ = circle approximation. |
| Dot Radius | Float | 0.01 | Radius of each dot in normalised units. |
| Dots Scale | Float | 1.0 | Uniform scale multiplier applied to all dots. Animatable for grow/shrink effects. |
| Dot Color | Color | 1, 0, 0.5, 1 | RGBA colour applied to all rendered dots. |
| Render Outline Shape | Checkbox | Off | Renders a stroke outline around each custom shape. |
| Render Outline Background | Checkbox | On | Renders an outline around the background area of each shape. |
| Shape Outline Width | Float | 0.002 | Stroke width of the shape outline in normalised units. |
| Background Outline Width | Float | 0.002 | Stroke width of the background outline in normalised units. |
| Shape Scale | Float | 1.0 | Uniform scale multiplier applied to all custom shapes. |
| Shape Color | Color | 1, 0.9, 0.6, 1 | RGBA colour applied to custom shapes rendered from the ArrayShape input. |
| Background Color | Color | 0.079, 0.079, 0.079, 1 | RGBA colour of the background fill behind each custom shape. |
| Text Size | Float | 0.025 | Size of the index label text rendered at each point when Show Index is enabled. |
| Text Style | Float | 1.0 | Style index for the index label font. |
| Text Color | Color | 1, 1, 1, 1 | RGBA colour of the index label text. |
| Line Type | Dropdown | Solid | Stroke pattern for connecting lines: Solid, Dashed, Dotted, or Dash-Dot. |
| Join Type | Dropdown | Round | Corner join style where lines meet: Miter, Bevel, or Round. |
| Input | Image | — | Background image input. The rendered shapes are composited over this image. Connect a Background node here. |
| Array Point | Array | — | Screen-space 2D point array. Connect the Output of vArrayCameraProjection here. |
| Array Edge | Array | — | Edge connectivity array. Defines explicit point-to-point connections for the line layer. Use with vArrayFromOBJ or vArrayPointsConnect. |
| Array Custom Shape | Array | — | Custom shape definitions array. Connect vArrayCustom2DShapes or vArrayCustom3DShapes here to render arbitrary polygons at each point. |
| Array Groups | Array | — | Group membership array for multi-group rendering. Used with font and text-path generators that output group data. |
| JSON Custom Color | Array | — | Per-point colour override array in JSON format. When connected, individual point colours override the global dot/shape colour settings. |
Read the full description
vArrayShapeRender is the terminal node in every vArray rendering pipeline. It takes the screen-space point array produced by vArrayCameraProjection and draws configurable shapes at each position — dots, connecting lines, custom polygons, or indexed text labels — composited over a Background image input. Everything upstream in the pipeline — generators, modifiers, projections — exists to feed this node with the right point data.
The node is built around five independent render layers, each with its own toggle. The Dots layer renders a polygon shape (3–32+ sides, controlled by Dot Sides) at each point position. The Lines layer draws connections between sequential points, or between explicit pairs when Use Edge Data is enabled with an ArrayEdge input. The Custom Shapes layer renders arbitrary 2D polygons from a vArrayCustom2DShapes node at each position. The Text Index layer renders the array index number at each point — invaluable for debugging point ordering. Each layer has its own colour picker and optional outline stroke, and all layers can be active simultaneously.
Four array inputs make ShapeRender the hub that unifies a pipeline. ArrayPoint is the primary position input — always required, always from vArrayCameraProjection. ArrayEdge provides explicit point-to-point connectivity for graph, network, and circuit-board visuals. ArrayShape carries custom polygon definitions for each point. ArrayGroups carries group membership data from text-path and font generators, used to control which points connect to which.
Colour handling is per-layer via RGBA pickers, but can be overridden per-point using the JSON Custom Color input — connect a vArrayColor node here to drive individual point colours from data. This makes vArrayShapeRender capable of full data-driven colour mapping without any post-processing nodes.
Performance scales directly with point count and enabled layers. The Lines and Custom Shapes layers are the most expensive — disable them during design if working with large arrays. The Show Index layer is a debug tool and should be disabled before final render. All layer toggles are animatable, which means you can use them as on/off switches driven by keyframes in reveal sequences.
Example Connections
- Standard pipeline — dots at projected points
- With custom polygon shapes
- Full pipeline — points, edges, shapes, groups
vArrayFromOBJ.Points -> vArrayCameraProjection.ArrayA
vArrayFromOBJ.Edges -> vArrayShapeRender.ArrayEdge
vArrayCameraProjection.Output -> vArrayShapeRender.ArrayPoint
Background.Output -> vArrayShapeRender.Input
vArrayPointsOnCircle.Output -> vArrayCameraProjection.ArrayA
vArrayCameraProjection.Output -> vArrayShapeRender.ArrayPoint
vArrayCustom2DShapes.Output -> vArrayShapeRender.ArrayShape
Background.Output -> vArrayShapeRender.Input
vArrayCreateTextFont.Output -> vArrayCameraProjection.ArrayA
vArrayCreateTextFont.ScriptVal_Groups -> vArrayShapeRender.ArrayGroups
vArrayCameraProjection.Output -> vArrayShapeRender.ArrayPoint
vArrayCustom2DShapes.Output -> vArrayShapeRender.ArrayShape
Background.Output -> vArrayShapeRender.Input